import os
cmap = "gray"This guide will run through the installation and basic usage of the solar mask library.
The package is availble on pypi here. To download, use the latest version of pip:
$ python3 -m pip install solarmaskVersioning is being fleshed out so that major bugs don't exist in a version. Currently, the latest release the the most updated version.
The main entry point to solarmask is active_region. Active regions have three subclasses: ActiveRegionParameters which extracts parameters, ActiveRegionDerivedFields which constructs new fields based on the Bz, Bx, By and continuum fields that are stored on the disk (such as horizontal B field Bh or Twist etc.) and ActiveRegionSegmentation which only deals with the segmentation of an active region into neutral lines, umbras, penumbras and a background. All of these classes can be called from their respective modules, but the user is encouraged to use all of these subclasses' functionality directly from the ActiveRegion class to avoid confusion.
To construct an active region, you need a harpnumber, date and root. The harpnumber and date are self explanitory, and the root is the location of the raw data folder containing magnetogram and continuum data.
First, let's define our root directory. If you use this code on a different system, change the cell below to your re located data folder - which should look similar to /docs/example_data/raw
root = "../example_data/raw"
assert os.path.exists(root)
Next, we could manually get a harpnumber and date if we know what is on our system, but solarmask will automatically detect harpnumbers and dates in the root directory. Lets find all of our harpnumbers first:
from solarmask.data import get_hnums
hnums = get_hnums(root)
print(hnums)
hnum = hnums[0]
[7115]
If we new each date in each harpnumber we are using, we could just manually build a datetime, but solarmask also automatically detects which dates are available in root:
from solarmask.data import get_dates
dates = get_dates(hnum, root)
print(dates)
date = dates[0]
[datetime.datetime(2017, 9, 6, 12, 0), datetime.datetime(2017, 9, 1, 22, 0)]
Now we have a valid harpnumber and date combo to build our active region with. Of course, we could manually define these two as well:
print(hnum, date)7115 2017-09-06 12:00:00
Now let's build an active region:
from solarmask.active_region import ActiveRegion

ar = ActiveRegion(hnum, date, root)
An active region alone is just a combination of x, y, z components of magnetic flux and the continuum:
import matplotlib.pyplot as plt
import numpy as np

fig, (ax1, ax2, ax3) = plt.subplots(1, 3)

ax1.imshow(ar.cont, cmap)
ax1.set_title("Continuum")
ax1.axis(False)

ax2.imshow(ar.Bz, cmap)
ax2.set_title("Line of sight magnetic field")
ax2.axis(False)

ax3.imshow(ar.Bh, cmap)
ax3.set_title("Horizontal magnetic field")
ax3.axis(False)

fig.set_figwidth(10)

plt.show()The main usage of active region is to extract the three datasets.
Each dataset is a dict with key value corresponding to each feature.
baseline = ar.baseline_dataset
print("BASELINE Dataset")
print(baseline)
BASELINE Dataset
{'Bz_tot': 48436571.73000002, 'Bz_totabs': 912665.0699999997, 'itot': 1158731875.8816144, 'itotabs': 513884.65279076196, 'itot_polarity': 69741420.32692963, 'ihtot': 260424630525.3697, 'ihtotabs': 3658852029.034691, 'hctot': 346536044344.56824, 'hctotabs': 152841919638.9422, 'totrho': 21887487.611776374, 'Bz_mean': 2.9610447920992518, 'Bz_std': 353.91205722553934, 'Bz_skew': 0.8624891360407722, 'Bz_kurt': 15.705697123960512, 'Bh_mean': 181.74443637163253, 'Bh_std': 301.11945941453774, 'Bh_skew': 4.275037651713445, 'Bh_kurt': 27.07156202696789, 'gamma_mean': -0.1003125604687583, 'gamma_std': 0.6785771694077445, 'gamma_skew': 0.20137146281062596, 'gamma_kurt': -1.0749836556997958, 'grad_B_mean': 49.819821037258365, 'grad_B_std': 72.48970397795553, 'grad_B_skew': 10.687045428877381, 'grad_B_kurt': 214.83928901171123, 'grad_Bz_mean': 51.636673855447874, 'grad_Bz_std': 81.89618924956946, 'grad_Bz_skew': 9.117129105709143, 'grad_Bz_kurt': 162.31031800893274, 'grad_Bh_mean': 37.43074113475015, 'grad_Bh_std': 59.7594595863308, 'grad_Bh_skew': 14.68324296531682, 'grad_Bh_kurt': 346.624428398112, 'J_mean': 1.667244123724181, 'J_std': 6921.2747549414735, 'J_skew': 5.779373559988659, 'J_kurt': 329.2113441555798, 'Jh_mean': 11870.756427256447, 'Jh_std': 7499866.0437582, 'Jh_skew': 8.102423095067055, 'Jh_kurt': 2704.456210827294, 'twist_mean': -5.383805555755496, 'twist_std': 5431.099285738268, 'twist_skew': 19.27497183475329, 'twist_kurt': 22725.394418643416, 'hc_mean': -495879.35929370264, 'hc_std': 7445779.2243369175, 'hc_skew': -7.804882836278778, 'hc_kurt': 1132.954225325227, 'shear_mean': 1.0360216908634599, 'shear_std': 0.5274806533779264, 'shear_skew': 0.7726592942127313, 'shear_kurt': 0.6151056886795883, 'rho_mean': 1784.7168367601291, 'rho_std': 10948.434868430033, 'rho_skew': 20.25839583283075, 'rho_kurt': 661.463797670551, 'hnum': 7115, 'date': datetime.datetime(2017, 9, 6, 12, 0), 'NOAA_ARS': '12673'}
segmented = ar.segmented_dataset
print("SEGMENTED Dataset")
print(segmented)
SEGMENTED Dataset
{'nl_Bz_tot': 1730154.0, 'nl_Bz_totabs': 74285.20000000001, 'nl_itot': 72911186.77918473, 'nl_itotabs': 5502452.308782724, 'nl_itot_polarity': 8855326.523065047, 'nl_ihtot': 77831129621.29727, 'nl_ihtotabs': 246844235.33597994, 'nl_hctot': 57063866401.77635, 'nl_hctotabs': 12216768812.036888, 'nl_totrho': 6131235.380608724, 'nl_Bz_mean': -18.233971526755035, 'nl_Bz_std': 723.3068414530032, 'nl_Bz_skew': -0.5455602300328546, 'nl_Bz_kurt': 5.615103176236618, 'nl_Bh_mean': 1132.8273410495333, 'nl_Bh_std': 851.3247532920949, 'nl_Bh_skew': 1.189955019812326, 'nl_Bh_kurt': 1.2650226810732885, 'nl_gamma_mean': 0.0018664835082713447, 'nl_gamma_std': 0.5023637771433762, 'nl_gamma_skew': 0.09755952858633657, 'nl_gamma_kurt': 0.6208295788868163, 'nl_grad_B_mean': 250.90027949302583, 'nl_grad_B_std': 349.3953113840282, 'nl_grad_B_skew': 3.0308016114527065, 'nl_grad_B_kurt': 10.88481453737684, 'nl_grad_Bz_mean': 344.88730013572416, 'nl_grad_Bz_std': 383.2043553122473, 'nl_grad_Bz_skew': 2.6043006508825277, 'nl_grad_Bz_kurt': 8.734908003414137, 'nl_grad_Bh_mean': 228.66409790596367, 'nl_grad_Bh_std': 314.4024010027067, 'nl_grad_Bh_skew': 3.119120396916261, 'nl_grad_Bh_kurt': 12.05226641966389, 'nl_J_mean': 1350.626487182799, 'nl_J_std': 36301.3813703652, 'nl_J_skew': 2.194293677572936, 'nl_J_kurt': 21.150018141171014, 'nl_Jh_mean': 60590.1412213991, 'nl_Jh_std': 54303638.36243972, 'nl_Jh_skew': 1.1000197859869298, 'nl_Jh_kurt': 49.72482179690839, 'nl_twist_mean': -61.65084948422465, 'nl_twist_std': 2743.295376656444, 'nl_twist_skew': -34.21663499485756, 'nl_twist_kurt': 1376.7499380434501, 'nl_hc_mean': -2998715.957790105, 'nl_hc_std': 43745259.95469983, 'nl_hc_skew': -0.8086331706840002, 'nl_hc_kurt': 49.02158246393265, 'nl_shear_mean': 1.312623532458661, 'nl_shear_std': 0.6785921010173062, 'nl_shear_skew': 0.39613934510892995, 'nl_shear_kurt': -0.6563335362453024, 'nl_rho_mean': 37823.945074423544, 'nl_rho_std': 65525.4269683639, 'nl_rho_skew': 3.5897674999601406, 'nl_rho_kurt': 18.422030655832334, 'umbra_Bz_tot': 9331012.15, 'umbra_Bz_totabs': 1249786.09, 'umbra_itot': 111803407.93025757, 'umbra_itotabs': 4292295.019404108, 'umbra_itot_polarity': 56418390.142805316, 'umbra_ihtot': 97321262838.26909, 'umbra_ihtotabs': 5082105337.676033, 'umbra_hctot': 153447868010.19266, 'umbra_hctotabs': 93188857576.94708, 'umbra_totrho': 4821409.698779788, 'umbra_Bz_mean': 202.2307588996764, 'umbra_Bz_std': 1611.3267901902395, 'umbra_Bz_skew': -0.12427922699027029, 'umbra_Bz_kurt': -1.5378657517251197, 'umbra_Bh_mean': 989.816124165762, 'umbra_Bh_std': 807.0218224645637, 'umbra_Bh_skew': 1.7154622517116105, 'umbra_Bh_kurt': 2.7119762905670717, 'umbra_gamma_mean': 0.10581819810686431, 'umbra_gamma_std': 1.0755717081793932, 'umbra_gamma_skew': -0.09957603505864095, 'umbra_gamma_kurt': -1.7010370380634439, 'umbra_grad_B_mean': 215.20990983045684, 'umbra_grad_B_std': 310.39938675031004, 'umbra_grad_B_skew': 3.333556391599753, 'umbra_grad_B_kurt': 13.385700916677653, 'umbra_grad_Bz_mean': 250.3393787235854, 'umbra_grad_Bz_std': 336.7864543342683, 'umbra_grad_Bz_skew': 3.2406671106765095, 'umbra_grad_Bz_kurt': 13.3761180411686, 'umbra_grad_Bh_mean': 203.67107608700925, 'umbra_grad_Bh_std': 284.50508557884376, 'umbra_grad_Bh_skew': 3.255946427787143, 'umbra_grad_Bh_kurt': 13.258087574035653, 'umbra_J_mean': 694.5461196446777, 'umbra_J_std': 33443.170473878774, 'umbra_J_skew': 1.9336158882692378, 'umbra_J_kurt': 20.367532971949995, 'umbra_Jh_mean': 822347.1420187756, 'umbra_Jh_std': 45982380.983916186, 'umbra_Jh_skew': 0.42178433137526916, 'umbra_Jh_kurt': 62.255261875977936, 'umbra_twist_mean': -10.995713821906223, 'umbra_twist_std': 404.8042341501762, 'umbra_twist_skew': -21.326298674508042, 'umbra_twist_kurt': 1471.38847273908, 'umbra_hc_mean': -15079103.16779079, 'umbra_hc_std': 45275193.86233077, 'umbra_hc_skew': -0.16372962408572886, 'umbra_hc_kurt': 33.90613282425271, 'umbra_shear_mean': 0.6014057695713156, 'umbra_shear_std': 0.4826412229661533, 'umbra_shear_skew': 1.9452218188249515, 'umbra_shear_kurt': 4.247818017702721, 'umbra_rho_mean': 19607.64438787464, 'umbra_rho_std': 56499.93589951711, 'umbra_rho_skew': 4.777613377124937, 'umbra_rho_kurt': 29.94096538592833, 'penumbra_Bz_tot': 12700424.08, 'penumbra_Bz_totabs': 3230314.2800000003, 'penumbra_itot': 108267025.28137878, 'penumbra_itotabs': 7984027.216685459, 'penumbra_itot_polarity': 33309689.63478607, 'penumbra_ihtot': 75461077924.0739, 'penumbra_ihtotabs': 2593777447.627201, 'penumbra_hctot': 93397266199.10783, 'penumbra_hctotabs': 50537641462.13954, 'penumbra_totrho': 11264777.669405933, 'penumbra_Bz_mean': 189.5057069107122, 'penumbra_Bz_std': 881.3975435745195, 'penumbra_Bz_skew': -0.18535533071855823, 'penumbra_Bz_kurt': -0.7543991001428036, 'penumbra_Bh_mean': 966.1163153303153, 'penumbra_Bh_std': 387.61354509898604, 'penumbra_Bh_skew': 1.2409064845957734, 'penumbra_Bh_kurt': 5.223827820555844, 'penumbra_gamma_mean': 0.14912841290339413, 'penumbra_gamma_std': 0.711764702496566, 'penumbra_gamma_skew': -0.2198079860927122, 'penumbra_gamma_kurt': -0.846557388222045, 'penumbra_grad_B_mean': 101.36553665378653, 'penumbra_grad_B_std': 114.9622603354428, 'penumbra_grad_B_skew': 7.975374352811998, 'penumbra_grad_B_kurt': 111.12473127738106, 'penumbra_grad_Bz_mean': 143.53862847667747, 'penumbra_grad_Bz_std': 134.67439648618864, 'penumbra_grad_Bz_skew': 3.1300004261657244, 'penumbra_grad_Bz_kurt': 17.72996218088503, 'penumbra_grad_Bh_mean': 80.11997970583656, 'penumbra_grad_Bh_std': 110.31153965658159, 'penumbra_grad_Bh_skew': 8.006431221222302, 'penumbra_grad_Bh_kurt': 109.26675504071154, 'penumbra_J_mean': -468.3812751780746, 'penumbra_J_std': 12138.613985964907, 'penumbra_J_skew': 4.448758547177717, 'penumbra_J_kurt': 139.35564332656756, 'penumbra_Jh_mean': 152163.40769841612, 'penumbra_Jh_std': 15444437.15680623, 'penumbra_Jh_skew': 12.207005871823018, 'penumbra_Jh_kurt': 858.970700647569, 'penumbra_twist_mean': -0.39764611473542794, 'penumbra_twist_std': 504.39754922721795, 'penumbra_twist_skew': -43.067305421673076, 'penumbra_twist_kurt': 3965.8839799010143, 'penumbra_hc_mean': -2964780.092815883, 'penumbra_hc_std': 12276917.815575985, 'penumbra_hc_skew': -9.681804603570226, 'penumbra_hc_kurt': 236.29880663697668, 'penumbra_shear_mean': 0.9615597184466406, 'penumbra_shear_std': 0.46696775654873457, 'penumbra_shear_skew': 0.6049189620751559, 'penumbra_shear_kurt': 0.5251511508392306, 'penumbra_rho_mean': 16608.86672323268, 'penumbra_rho_std': 23194.273646323447, 'penumbra_rho_skew': 5.858877508475619, 'penumbra_rho_kurt': 69.13803682789747, 'hnum': 7115, 'date': datetime.datetime(2017, 9, 6, 12, 0), 'NOAA_ARS': '12673'}
sharps = ar.sharps_dataset
print("SHARPS Dataset")
print(sharps)
SHARPS Dataset
{'USFLUX': 4.533103e+22, 'MEANGAM': 51.792, 'MEANGBT': 110.105, 'MEANGBZ': 126.385, 'MEANGBH': 76.954, 'MEANJZD': -0.31327546, 'TOTUSJZ': 100571700000000.0, 'MEANALP': -0.06190259, 'MEANJZH': -0.03697439, 'TOTUSJH': 7357.481, 'ABSNJZH': 2271.374, 'SAVNCPP': 78371730000000.0, 'MEANPOT': 21630.71, 'TOTPOT': 1.764815e+24, 'MEANSHR': 45.785, 'SHRGT45': 47.17, 'R_VALUE': 5.305}
solarmask.active_region_segments.ActiveRegionSegmentsis a class that segments the original four data products into an umbra, neutral line, penumbra and background, but as stated, use these with the ActiveRegion class
fig, (ax1, ax2) = plt.subplots(1, 2)

ax1.imshow(ar.cont, cmap)
ax1.axis(False)
ax1.set_title("Original Continuum")

ax2.imshow(ar.umbra_mask, cmap)
ax2.axis(False)
ax2.set_title("Segmented Umbras")

fig.set_figwidth(20)
fig.set_figwidth(20)

plt.show()fig, (ax1, ax2) = plt.subplots(1, 2)
ax1.imshow(ar.cont, cmap)
ax1.axis(False)
ax1.set_title("Original Continuum")
ax2.imshow(ar.penumbra_mask, cmap)
ax2.axis(False)
ax2.set_title("Segmented Penumbras")
fig.set_figwidth(20)
fig.set_figwidth(20)
plt.savefig("./outputs/penumbras.png")
plt.show()fig, (ax1, ax2) = plt.subplots(1, 2)
Bz = ar.Bz.copy()
Bz[Bz > 0] = 1
Bz[Bz < 0] = -1
pcm = ax1.imshow(Bz, cmap)
ax1.axis(False)
ax1.set_title("Original LOS Magnetogram (Binary Pos and Negative Only)")
fig.colorbar(pcm, ax = ax1)
ax2.imshow(ar.nl_mask, cmap)
ax2.axis(False)
ax2.set_title("Segmented Neutral Line")
fig.set_figwidth(20)
fig.set_figwidth(20)
plt.savefig("./outputs/nl.png")
plt.show()fig, (ax1, ax2) = plt.subplots(1, 2)
ax1.imshow(ar.cont, cmap)
ax1.axis(False)
ax1.set_title("Original Continuum")
ax2.imshow(ar.background_mask, cmap)
ax2.axis(False)
ax2.set_title("Segmented Background")
fig.set_figwidth(20)
fig.set_figwidth(20)
plt.savefig("./outputs/background.png")
plt.show()solarmask.active_region_derived_fields.ActiveRegionDerivedFieldsHere are the original fields (the raw data that is extracted from the disc).
fig, (ax1, ax2, ax3, ax4) = plt.subplots(1, 4)

ax1.imshow(ar.cont, cmap)
ax1.axis(False)
ax1.set_title("Continuum")

ax2.imshow(ar.Bz, cmap)
ax2.axis(False)
ax2.set_title("Bz (line of sight magnetic flux)")

ax3.imshow(ar.Bx, cmap)
ax3.axis(False)
ax3.set_title("Bx (x component of magnetic flux)")

ax4.imshow(ar.By, cmap)
ax4.axis(False)
ax4.set_title("By (y component of magnetic flux)")

fig.set_figwidth(20)
fig.set_figwidth(20)

plt.show()
And all of the derived fields:
derived_fields = ["Bh", "gamma", "B", "grad_B_x", "grad_B_y", "grad_B", "grad_Bh", "grad_Bh_x", "grad_Bh_y", "grad_Bz", "grad_Bz_x", "grad_Bz_y", "grad_Bx", "grad_Bx_x", "grad_Bx_y", "grad_By", "grad_By_x", "grad_By_y", "J", "Jh", "hc", "twist", "shear", "rho", "Bpx", "Bpy", "Bpz"]

fig, axs = plt.subplots(9, 3)

k = 0
for i in range(9):
    for j in range(3):
        axs[i][j].imshow(getattr(ar, derived_fields[k]), cmap)
        axs[i][j].axis(False)
        axs[i][j].set_title(derived_fields[k])
        k += 1

fig.set_figwidth(20)
fig.set_figheight(50)
plt.show()solarmask.active_region_parameters.ActiveRegionParametersParameters are computed using a binary mask. To demonstrate, we will first compute the parameter on the entire region, then on a randomized binary mask
Parameters are either single scalars (for example, the sum of flux over the mask), or expressed as the first four statistical moments of a magnetic field (average, standard deviation, skew and kurtosis).
full_mask = np.ones(ar.shape, dtype = bool)

for func in ar.scalar_features:
    rmask = np.random.choice([True, False], ar.shape)

    full_data = func(full_mask)
    rmask_data = func(rmask)

    print(func.__name__)
    print(f"    Full Mask: {full_data:.2f}")
    print(f"    Rand Mask: {rmask_data:.2f}")
Bz_tot
Full Mask: 48436571.73
Rand Mask: 24166936.01
Bz_totabs
Full Mask: 912665.07
Rand Mask: 484950.29
itot
Full Mask: 1158731875.88
Rand Mask: 580027916.47
itotabs
Full Mask: 513884.65
Rand Mask: 2932016.42
itot_polarity
Full Mask: 69741420.33
Rand Mask: 36128169.30
ihtot
Full Mask: 260424630525.37
Rand Mask: 131237311628.62
ihtotabs
Full Mask: 3658852029.03
Rand Mask: 3103011378.85
hctot
Full Mask: 346536044344.57
Rand Mask: 172267782225.89
hctotabs
Full Mask: 152841919638.94
Rand Mask: 72413133070.69
totrho
Full Mask: 21887487.61
Rand Mask: 10903698.75
from solarmask.utils import stat_moment_label, stat_moment # labels and gets mean, std, skew and kurtosis from a given set of data

for func in ar.stat_moments:
    print(func)
    rmask = np.random.choice([True, False], ar.shape)

    field = getattr(ar, func)

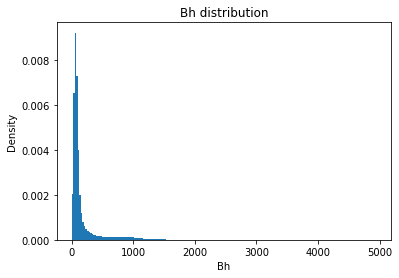
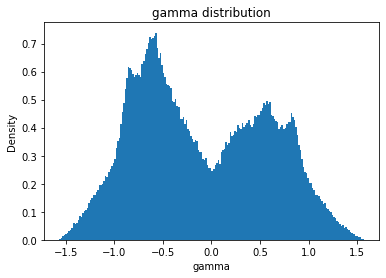
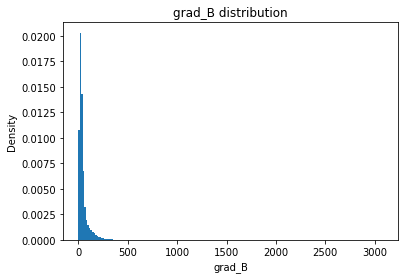
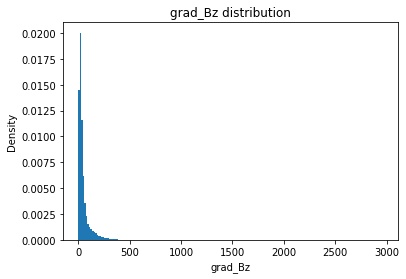
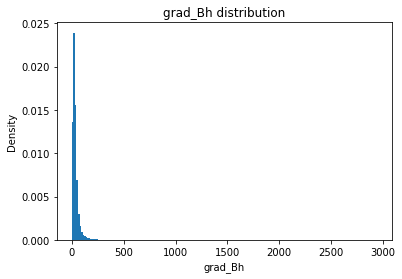
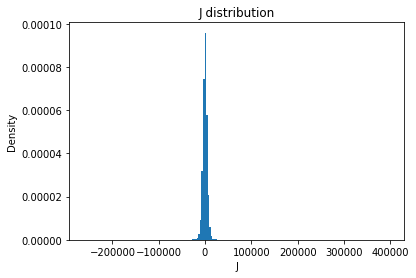
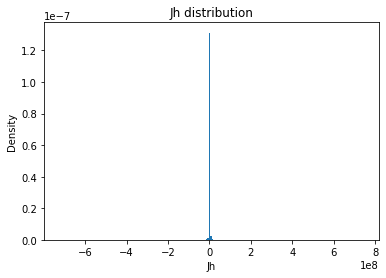
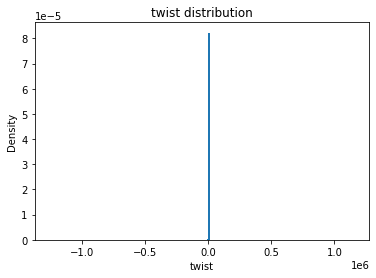
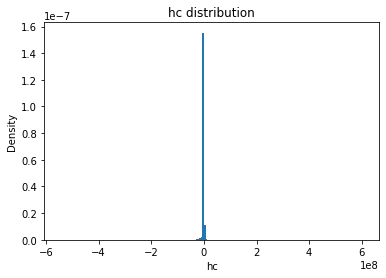
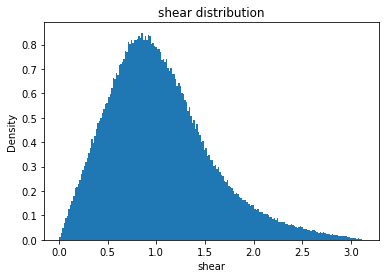
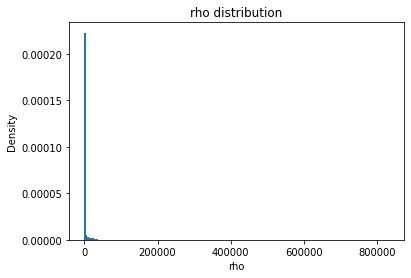
    plt.hist(field.flatten(), density = True, bins = 200)
    plt.title(func + " distribution")
    plt.xlabel(func)
    plt.ylabel("Density")
    plt.show()


    labels = stat_moment_label(func)
    values_full = stat_moment(field[full_mask])
    values_rand = stat_moment(field[rmask])

    for label, f, r in zip(labels, values_full, values_rand):
        print(f"    {label}")
        print(f"        Full Mask: {f:.2f}")
        print(f"        Rand Mask: {r:.2f}")
Bz
    Bz_mean
        Full Mask: 2.96
        Rand Mask: 3.02
    Bz_std
        Full Mask: 353.91
        Rand Mask: 355.30
    Bz_skew
        Full Mask: 0.86
        Rand Mask: 0.82
    Bz_kurt
        Full Mask: 15.71
        Rand Mask: 15.94
Bh
    Bh_mean
        Full Mask: 181.74
        Rand Mask: 181.44
    Bh_std
        Full Mask: 301.12
        Rand Mask: 299.84
    Bh_skew
        Full Mask: 4.28
        Rand Mask: 4.23
    Bh_kurt
        Full Mask: 27.07
        Rand Mask: 26.36
gamma
    gamma_mean
        Full Mask: -0.10
        Rand Mask: -0.10
    gamma_std
        Full Mask: 0.68
        Rand Mask: 0.68
    gamma_skew
        Full Mask: 0.20
        Rand Mask: 0.20
    gamma_kurt
        Full Mask: -1.07
        Rand Mask: -1.07
grad_B
    grad_B_mean
        Full Mask: 49.82
        Rand Mask: 49.69
    grad_B_std
        Full Mask: 72.49
        Rand Mask: 71.83
    grad_B_skew
        Full Mask: 10.69
        Rand Mask: 10.38
    grad_B_kurt
        Full Mask: 214.84
        Rand Mask: 201.05
grad_Bz
    grad_Bz_mean
        Full Mask: 51.64
        Rand Mask: 51.64
    grad_Bz_std
        Full Mask: 81.90
        Rand Mask: 82.53
    grad_Bz_skew
        Full Mask: 9.12
        Rand Mask: 9.45
    grad_Bz_kurt
        Full Mask: 162.31
        Rand Mask: 175.72
grad_Bh
    grad_Bh_mean
        Full Mask: 37.43
        Rand Mask: 37.44
    grad_Bh_std
        Full Mask: 59.76
        Rand Mask: 59.28
    grad_Bh_skew
        Full Mask: 14.68
        Rand Mask: 14.55
    grad_Bh_kurt
        Full Mask: 346.62
        Rand Mask: 334.47
J
    J_mean
        Full Mask: 1.67
        Rand Mask: -7.25
    J_std
        Full Mask: 6921.27
        Rand Mask: 6803.49
    J_skew
        Full Mask: 5.78
        Rand Mask: 4.36
    J_kurt
        Full Mask: 329.21
        Rand Mask: 279.52
Jh
    Jh_mean
        Full Mask: 11870.76
        Rand Mask: -3903.42
    Jh_std
        Full Mask: 7499866.04
        Rand Mask: 7291553.43
    Jh_skew
        Full Mask: 8.10
        Rand Mask: -4.79
    Jh_kurt
        Full Mask: 2704.46
        Rand Mask: 3471.61
twist
    twist_mean
        Full Mask: -5.38
        Rand Mask: -11.19
    twist_std
        Full Mask: 5431.10
        Rand Mask: 5616.44
    twist_skew
        Full Mask: 19.27
        Rand Mask: -4.17
    twist_kurt
        Full Mask: 22725.39
        Rand Mask: 30353.33
hc
    hc_mean
        Full Mask: -495879.36
        Rand Mask: -513499.04
    hc_std
        Full Mask: 7445779.22
        Rand Mask: 7413225.13
    hc_skew
        Full Mask: -7.80
        Rand Mask: -12.93
    hc_kurt
        Full Mask: 1132.95
        Rand Mask: 1220.15
shear
    shear_mean
        Full Mask: 1.04
        Rand Mask: 1.04
    shear_std
        Full Mask: 0.53
        Rand Mask: 0.53
    shear_skew
        Full Mask: 0.77
        Rand Mask: 0.77
    shear_kurt
        Full Mask: 0.62
        Rand Mask: 0.61
rho
    rho_mean
        Full Mask: 1784.72
        Rand Mask: 1777.62
    rho_std
        Full Mask: 10948.43
        Rand Mask: 10749.47
    rho_skew
        Full Mask: 20.26
        Rand Mask: 19.21
    rho_kurt
        Full Mask: 661.46
        Rand Mask: 554.70
The four segments (neutral line, umbra, penumbra and neutral line) can be written to the disk as binary files. This is a very compressed version of the map where the first 8 bytes represent the shape of the data, and the remaining data is a bitstring that contains 1's and 0's where pixels are true or false.
nl_mask = ar.nl_mask
um_mask = ar.umbra_mask
pu_mask = ar.penumbra_mask
bk_mask = ar.background_mask

from solarmask.data import write_mask, read_mask

write_mask(nl_mask, hnum, date, "./masks/nl")
nl_mask_2 = read_mask(hnum, date, "./masks/nl")
assert np.all(nl_mask == nl_mask_2)

write_mask(um_mask, hnum, date, "./masks/umbra")
um_mask_2 = read_mask(hnum, date, "./masks/umbra")
assert np.all(um_mask == um_mask_2)

write_mask(pu_mask, hnum, date, "./masks/penumbra")
pu_mask_2 = read_mask(hnum, date, "./masks/penumbra")
assert np.all(pu_mask == pu_mask_2)

write_mask(bk_mask, hnum, date, "./masks/background")
bk_mask_2 = read_mask(hnum, date, "./masks/background")
assert np.all(bk_mask == bk_mask_2)
Don't worry, you don't need to know how the process works below. If you are curious, here is the compression algorithm:
A mask that looked like this:
True False True False True
True True True True True
True True True True True
True True True False True
True False False True True
Would be converted to:
1 0 1 0 1
1 1 1 1 1
1 1 1 1 1
1 1 1 0 1
1 0 0 1 1
Then flattened:
1010111111111111110110011
Buffered by 0's so the length is a multiple of 8:
00000001010111111111111110110011
Converted to bytes:
00000001 01011111 11111111 10110011
0x01 0x5F 0xFF 0xB3
Then we add the shape (5 x 5) = (0x00 0x00 0x00 0x05 0x00 0x00 0x00 0x05) to the beginning:
0x00 0x00 0x00 0x05 0x00 0x00 0x00 0x05 0x01 0x5F 0xFF 0xB3
Note that if everything is False, I just have the shape of the mask (no proceeding data)
Let's see this in action. If a mask is size nxm, then the number of bits in the bit string is nm, the number of buffer bits is nm % 8, and the number of prefix bits is 2x4x8 = 64 so the number of bytes is going to be nm + (nm % 8) + 64 plus one null terminator byte
Then the total number of bytes in a file is (nm + (nm % 8) + 64) / 8 + 1
n, m = nl_mask.shape

print((n*m + ((n * m) % 8) + 64) / 8 + 1)

f_size = os.stat("./masks/nl/sharp_7115/mask_7115_20170906_120000.bin").st_size

print(f_size)
38537.0
38537


