-
Notifications
You must be signed in to change notification settings - Fork 0
/
04-example-dataset.Rmd
37 lines (19 loc) · 2.62 KB
/
04-example-dataset.Rmd
1
2
3
4
5
6
7
8
9
10
11
12
13
14
15
16
17
18
19
20
21
22
23
24
25
26
27
28
29
30
31
32
33
34
35
36
# Example Analysis
## SH-SY5Y Differentiation
SH-SY5Y is a commonly used neuroblastoma cell line.
With appropriate treatment, it can be induced to differentiate into a ‘more neuronal’ form.
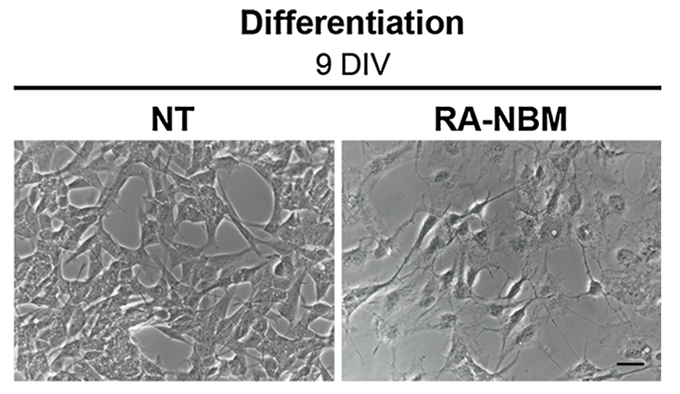
Differentiated cells look quite different, growing thin neurites out from the body of the cell.
<!--  -->
<!-- seems to point to content dir not common root : -->
```{r, echo=FALSE, out.width="100%", fig.align = "center", fig.cap="Morphological analysis of differentiated SH-SY5Y cells.<br>At 6-DIV stage, the cells exposed to RA showed an elongated morphology as compared to basal medium (NT). Cells subsequently treated in NBM for 3 days became more polarised, exhibited several neurites and branches and acquired a neuronal-like shape<br><br>Image is derived from Figure 4 (Pezzini et al. 2017)."}
#knitr::include_graphics("https://monashbioinformaticsplatform.github.io/enrichment_analysis_workshop/img/shsy5ydiff.png")
knitr::include_graphics("images/shsy5ydiff.png")
```
<!-- _Image is derived from Figure 4 (Pezzini et al. 2017)_ -->
## The question: What pathways are involved in SH-SY5Y Differentiation?
In their paper [_Transcriptomic Profiling Discloses Molecular and Cellular Events Related to Neuronal Differentiation in SH-SY5Y Neuroblastoma Cells_](https://link.springer.com/article/10.1007%2Fs10571-016-0403-y), Pezzini et al. induced neuronal differentiation of the SH-SY5Y neuroblastoma cell line and measured transcriptomic changes using RNA sequencing (Pezzini et al. 2017). During the 9-day differentiation protocol, SH-SY5Y cells were initially pre-differentiated in a retinoic acid (RA) medium for 6 days, followed by a 3-day treatment with a neurobasal medium (NBM) enriched with neurotrophic factors. Control cells, which were not treated (NT), were maintained under basal conditions and served as a comparison group. The authors then performed functional enrichment analysis on the differentially expressed genes.
## The data : Differentially expressed genes
The example dataset for today is the RNAseq differential expression results.
They can be accessed via this [Degust](http://degust.erc.monash.edu/degust/compare.html?code=5b2c7805ab8f8c5f2dc8c72e61b049b0#?plot=mds) link:
This has been reanalysed from the published raw data, via the degust tool.
> **Note:** Other tools and approaches may produce different-looking results, but generally, you will end up with a table of genes containing some measure of statistical confidence. The methods for functional enrichment analysis should remain similar.