-
Notifications
You must be signed in to change notification settings - Fork 26
How to Visualizing the AoLP Image
Ryota MAEDA edited this page Dec 25, 2022
·
12 revisions
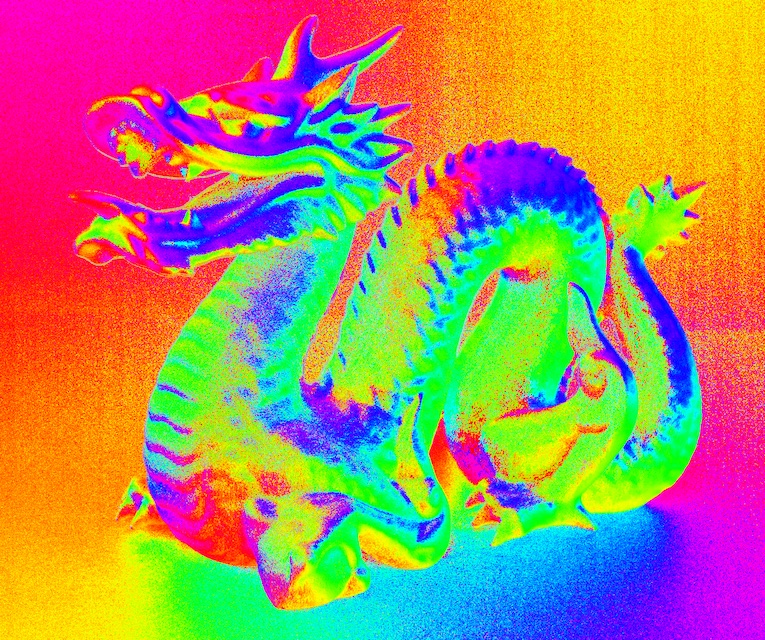
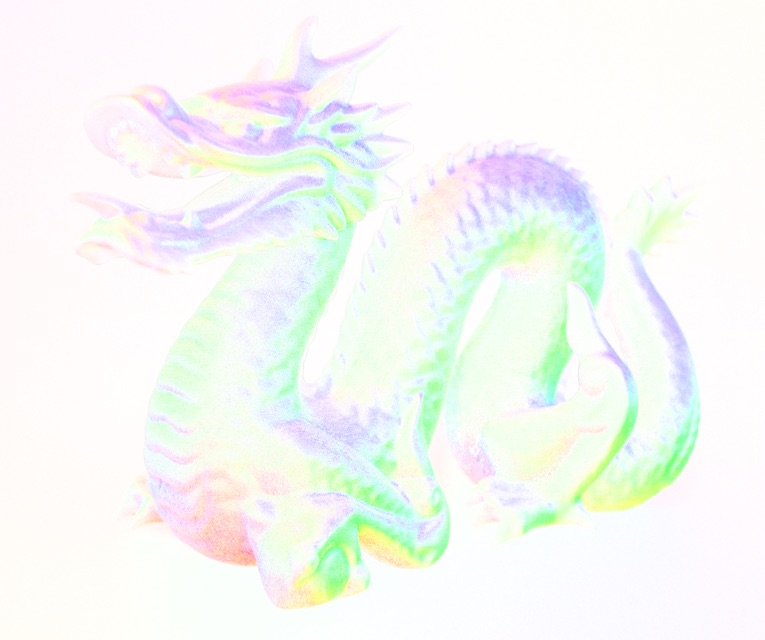
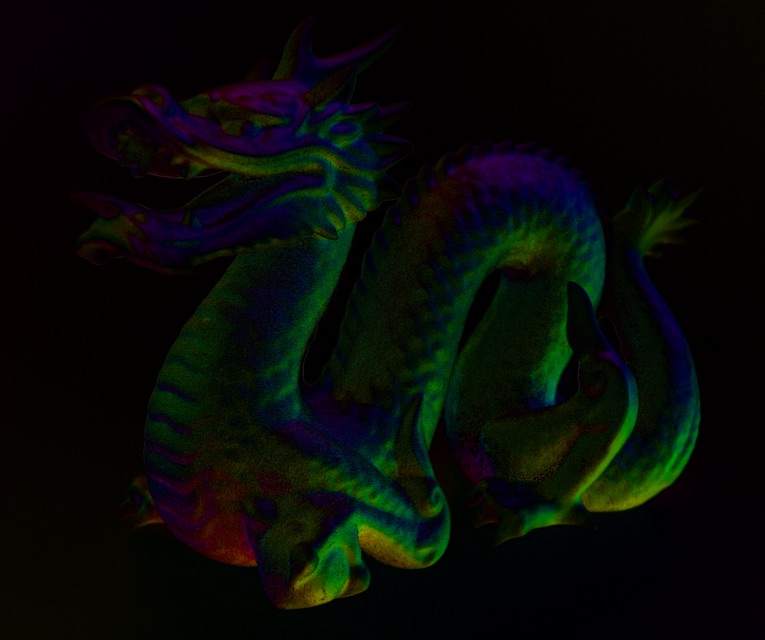
When visualizing the AoLP image, it is often used to map them to the Hue of HSV color space. In this case, the DoLP image may be used at the same time; it is brighter when it corresponds to Saturation and darker when it corresponds to Value. This makes it easier to recognize the polarization state because the highly polarized areas are colored.
Polanalyser can visualize the AoLP image in three ways. The result of the visualization and the corresponding color maps are shown below. The color map corresponds to AoLP for rotation angle and DoLP for radius.
Try it with Polanalyser:
| AoLP(Hue) Image | Color Map |
|---|---|
 |
 |
img_AoLP_cmapped = pa.applyColorToAoLP(img_AoLP)| AoLP(Hue)+DoLP(Saturation) Image | Color Map |
|---|---|
 |
 |
img_AoLP_cmapped = pa.applyColorToAoLP(img_AoLP, saturation=img_DoLP)| AoLP(Hue)+DoLP(Value) Image | Color Map |
|---|---|
 |
 |
img_AoLP_cmapped = pa.applyColorToAoLP(img_AoLP, value=img_DoLP)