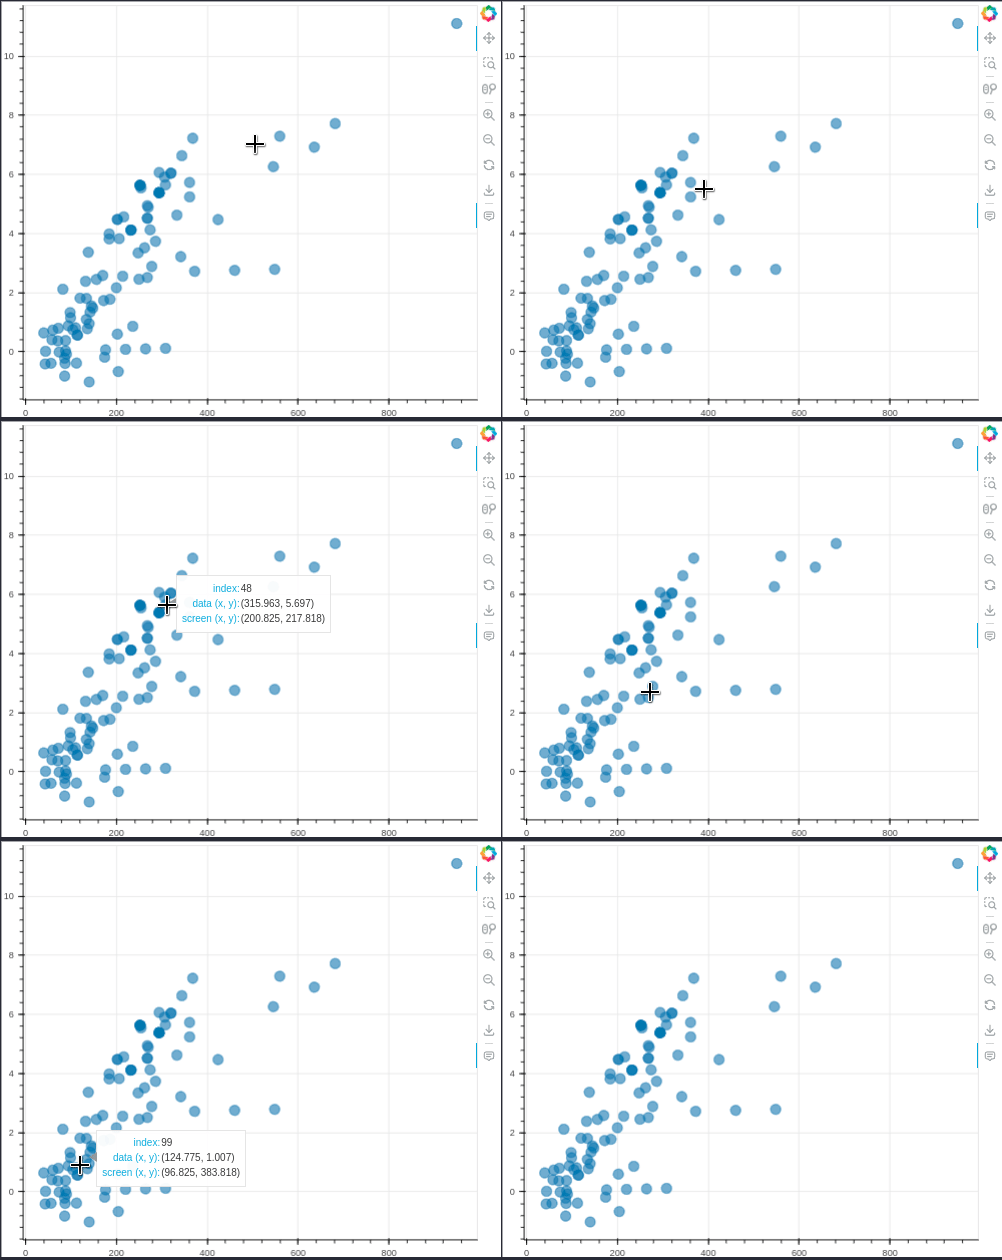
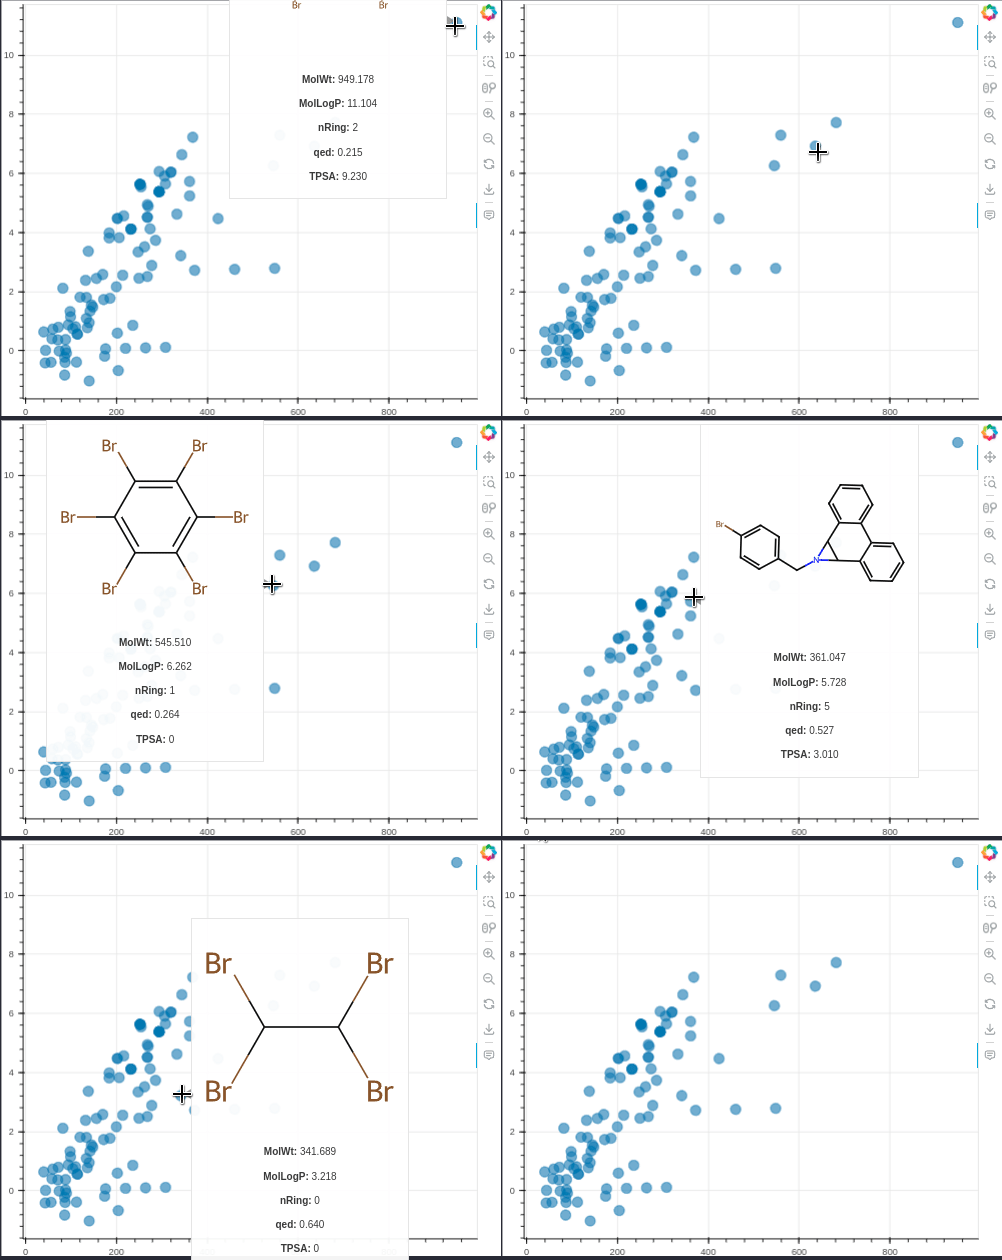
MolBokeh is a simple package for viewing the image of molecules in interactive graphics from the Bokeh package without the need to run a web application such as flask or dash in the backend, thus facilitating integration with other tools and codes.
pip3 install molbokeh
For more detailed usage examples, look the notebook at example/how_to_use.ipynb or open in Google Colab (Opt1), Colab (Opt2)
import pandas as pd
from MolBokeh import MolBokeh
from bokeh.plotting import figure,show
from bokeh.models import ColumnDataSource

path = 'data.csv'
df = pd.read_csv(path)

source = ColumnDataSource(df)
fig = figure(width=600, height=500,tools="pan,box_zoom,wheel_zoom,zoom_in,zoom_out,reset,save,hover")
fig.scatter(x='MolWt', y='MolLogP', source=source, size=12,alpha=0.6)

## Adding molecules
fig = MolBokeh().add_molecule(fig=fig,
                              source=source,
                              smilesColName='Smiles_canon',
                              hoverAdditionalInfo=['MolWt','MolLogP','nRing','qed','TPSA'],
                              molSize=(100,100))
show(fig)| Parameter | Type | Default | Description |
|---|---|---|---|
fig |
bokeh.plotting._figure.figure |
required | Bokeh plot object created from source(df) |
source |
bokeh.models.sources.ColumnDataSource |
required | Bokeh data type used to plot initial chart. |
smilesColName |
str |
required | Smiles column name in dataframe used to create source object |
hoverAdditionalInfo |
None or list |
None |
List of column names (variables) to be shown within the graphs hover. |
molSize |
tuple |
(150,150) |
Size of the image of the molecule to be shown within the hover, also changes the size of the hover frame |


