NagiosXI Widget for Smashing
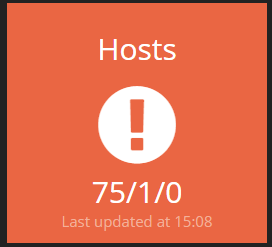
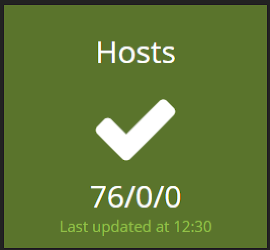
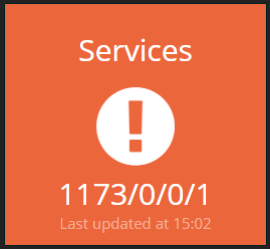
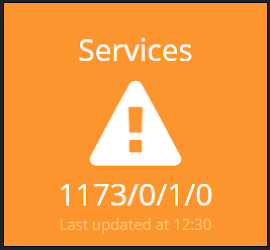
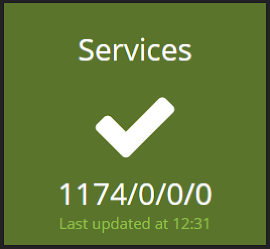
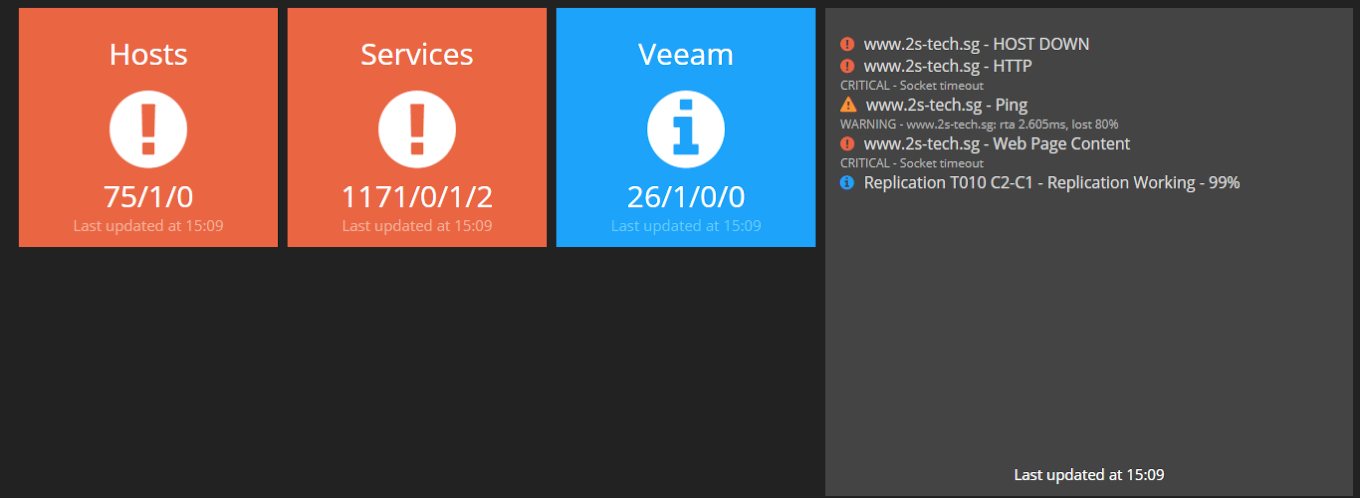
Smashing widget to monitor the status of Hosts and Services from Nagios XI. The numbers in the tiles represent the following:
- Hosts: OK/DOWN/UNREACHABLE
- Services: OK/UNKNOWN/WARNING/CRITICAL
This widget uses rest-client and json. make sure to add them in your dashboard Gemfile
gem 'rest-client'
gem 'json'
and to run the update command to download and install them.
$ bundle updateCreate a nagiosxi folder in your /widgets directory and clone this repository inside it. make a symolic link of the file jobs/nagiosxi.rb in the /jobs/ directory of your dashboard. For example, if your smashing installation directory is in /opt/dashboard/ you would run this:
$ ln -s /opt/dashboard/widgets/nagiosxi/jobs/nagiosxi.rb /opt/dashboard/jobs/nagiosxi.rbconfigure nagiosxi.rb job file for your environment:
apiKey = 'xxxxxxx' # The API Key generated in your Nagios XI
nagiosHOST = 'your.nagiosxihost.name' # IP Address or Hostname of your Nagios XI server
add the tiles in your dashboard .erb file
    <li data-row="2" data-col="2" data-sizex="1" data-sizey="1">
      <div data-id="nagiosxi" data-view="Nagiosxi" data-title="Infrastructure"></div>
    </li>
Messages widget integration
Since this widget only displays the status of the Services and Hosts, I had the need to visualize the details in case the status was not OK. The nagiosxi.rb job is setup in a way to send detailed information to the widget Messages I developed to organize "messages" of other widgets in a single box.
Distributed under the MIT license
