Please add alt text (alternative text) to all of your posted graphics for #TidyTuesday.
Twitter provides guidelines for how to add alt text to your images.
The DataViz Society/Nightingale by way of Amy Cesal has an article on writing good alt text for plots/graphs.
Here's a simple formula for writing alt text for data visualization:
It's helpful for people with partial sight to know what chart type it is and gives context for understanding the rest of the visual. Example: Line graph
What data is included in the chart? The x and y axis labels may help you figure this out. Example: number of bananas sold per day in the last year
Think about why you're including this visual. What does it show that's meaningful. There should be a point to every visual and you should tell people what to look for. Example: the winter months have more banana sales
Don't include this in your alt text, but it should be included somewhere in the surrounding text. People should be able to click on a link to view the source data or dig further into the visual. This provides transparency about your source and lets people explore the data. Example: Data from the USDA
Penn State has an article on writing alt text descriptions for charts and tables.
Charts, graphs and maps use visuals to convey complex images to users. But since they are images, these media provide serious accessibility issues to colorblind users and users of screen readers. See the examples on this page for details on how to make charts more accessible.
The {rtweet} package includes the ability to post tweets with alt text programatically.
Need a reminder? There are extensions that force you to remember to add Alt Text to Tweets with media.
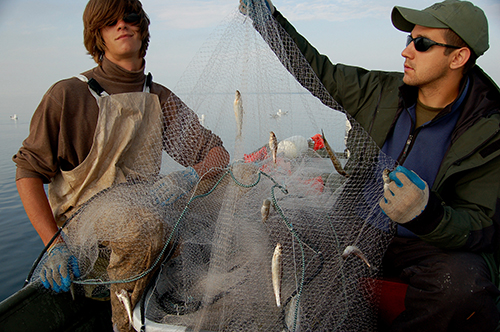
The data this week comes from Great Lakes Fishery Commission. Full details on the data can be found on their statistic notes and background notes.
Commercial fish catch data (called production) were published by the Great Lakes Fishery Commission in 1962 (Technical Report No.3) and covered the period 1867-1960. A supplement covering the years 1961-1968 was released in 1970, and a revised edition covering the years 1867-1977 was published in 1979. This third update of a web-based version covers the period 1867-2015. The intent is to update at approximately five-year intervals. The files are intended for open use by the public. We ask only that the commission be acknowledged when these records are used in presentations and publications.
Another article from the Detroit Free Press on King salmon reign becomes more precarious on changing Great Lakes.
It's the undisputed king sport fish of the Great Lakes — it says so right in its name.
For a half-century, the chinook, or king salmon — an ocean fish transplanted into the Great Lakes from the Pacific Northwest — has sent fisherman piling into boats every spring and summer, or queuing up on the banks of inland rivers every fall, its fierce fight on the line like a siren's song.
First stocked regularly in the Great Lakes beginning in 1966, the kings led a complete turnaround in the Great Lakes fishery, helping create a $7 billion economic impact. As recently as 2012, Michigan's Great Lakes fishing charters averaged 7.4 king salmon caught per trip.
It's unlikely it will ever be like that again.
Invasive zebra and quagga mussels have spread so pervasively throughout the Great Lakes, their filtration of nutrients from lake water has caused ripple effects throughout the food web. It's led to steep declines in the populations of another invasive species that is the chinook salmon's almost exclusive diet — the alewife, a silvery herring.
# Get the Data

# Read in with tidytuesdayR package
# Install from CRAN via: install.packages("tidytuesdayR")
# This loads the readme and all the datasets for the week of interest

# Either ISO-8601 date or year/week works!

tuesdata <- tidytuesdayR::tt_load('2021-06-08')
tuesdata <- tidytuesdayR::tt_load(2021, week = 24)

fishing <- tuesdata$fishing

# Or read in the data manually

fishing <- readr::read_csv('https://raw.githubusercontent.com/rfordatascience/tidytuesday/master/data/2021/2021-06-08/fishing.csv')
stocked <- readr::read_csv('https://raw.githubusercontent.com/rfordatascience/tidytuesday/master/data/2021/2021-06-08/stocked.csv')
| variable | class | description |
|---|---|---|
| year | double | Year of measurement |
| lake | character | Lake Name |
| species | character | Species of fish |
| grand_total | double | Grand total of observed |
| comments | character | Comments from the dataset providers |
| region | character | Region of the US/Canada, note there is some inconsistency |
| values | double | Production amounts have been rounded to the nearest thousand pounds |
| variable | class | description |
|---|---|---|
| SID | double | Unique ID |
| YEAR | double | Year |
| MONTH | double | Month |
| DAY | double | Day |
| LAKE | character | Lake |
| STATE_PROV | character | State Province |
| SITE | character | Site name |
| ST_SITE | character | Site code |
| LATITUDE | logical | Latitude |
| LONGITUDE | logical | Longitude |
| GRID | double | Army Corps of Engineers grid |
| STAT_DIST | character | Statistical district |
| LS_MGMT | character | Lake trout management units |
| SPECIES | character | Species |
| STRAIN | character | Strain of fish |
| NO_STOCKED | double | Number of fish stocked |
| YEAR_CLASS | double | Closest year in which hatching and onset of exogenous feeding occurs. |
| STAGE | character | Life history of stage |
| AGEMONTH | double | Age in months |
| MARK | character | Marking method |
| MARK_EFF | double | Marking efficiency |
| TAG_NO | logical | Tag Number |
| TAG_RET | double | Tag Retention in percent |
| LENGTH | double | Average length of stock in mm |
| WEIGHT | double | Average weight of fish stocked in kg |
| CONDITION | double | Qualitative condition of fish at stocking |
| LOT_CODE | character | Lot Code |
| STOCK_METH | character | Stock method code |
| AGENCY | character | Stocking agency code |
| VALIDATION | double | Validation accuracy |
| NOTES | character | Notes/comments |
library(tidyverse)
library(readxl)

raw_df <- read_excel("commercial.xls")

raw_df %>%
  pivot_longer(
    names_to = "region",
    values_to = "values",
    cols = 4:9
  ) %>%
  janitor::clean_names()


clean_and_pivot <- function(sheet, cols_long){

  raw_df <- read_excel("commercial.xls", sheet = sheet)

  raw_df %>%
    select(-contains("...")) %>%
    pivot_longer(
      names_to = "region",
      values_to = "values",
      cols = all_of(cols_long)
    ) %>%
    janitor::clean_names() %>%
    rename_with(~str_replace(.x, "totals", "total"))

}

clean_and_pivot(6, 4:5)

all_data <- tribble(
  ~sheet, ~cols_long,
  1, 4:9,
  2, 4:5,
  3, 4:10,
  4, 4:8,
  5, 4:12,
  6, 4:5
) %>%
  pmap_dfr(clean_and_pivot)

all_data %>%
  filter(str_detect(region, "U.S. Total")) %>%
  filter(!is.na(region)) %>%
  mutate(species = fct_lump(species, 12)) %>%
  filter(species != "Other") %>%
  ggplot(aes(x = year, y = values, color = lake)) +
  geom_line() +
  facet_wrap(~species) +
  theme(legend.position = "top")

all_data %>%
  write_csv("2021/2021-06-08/fishing.csv")