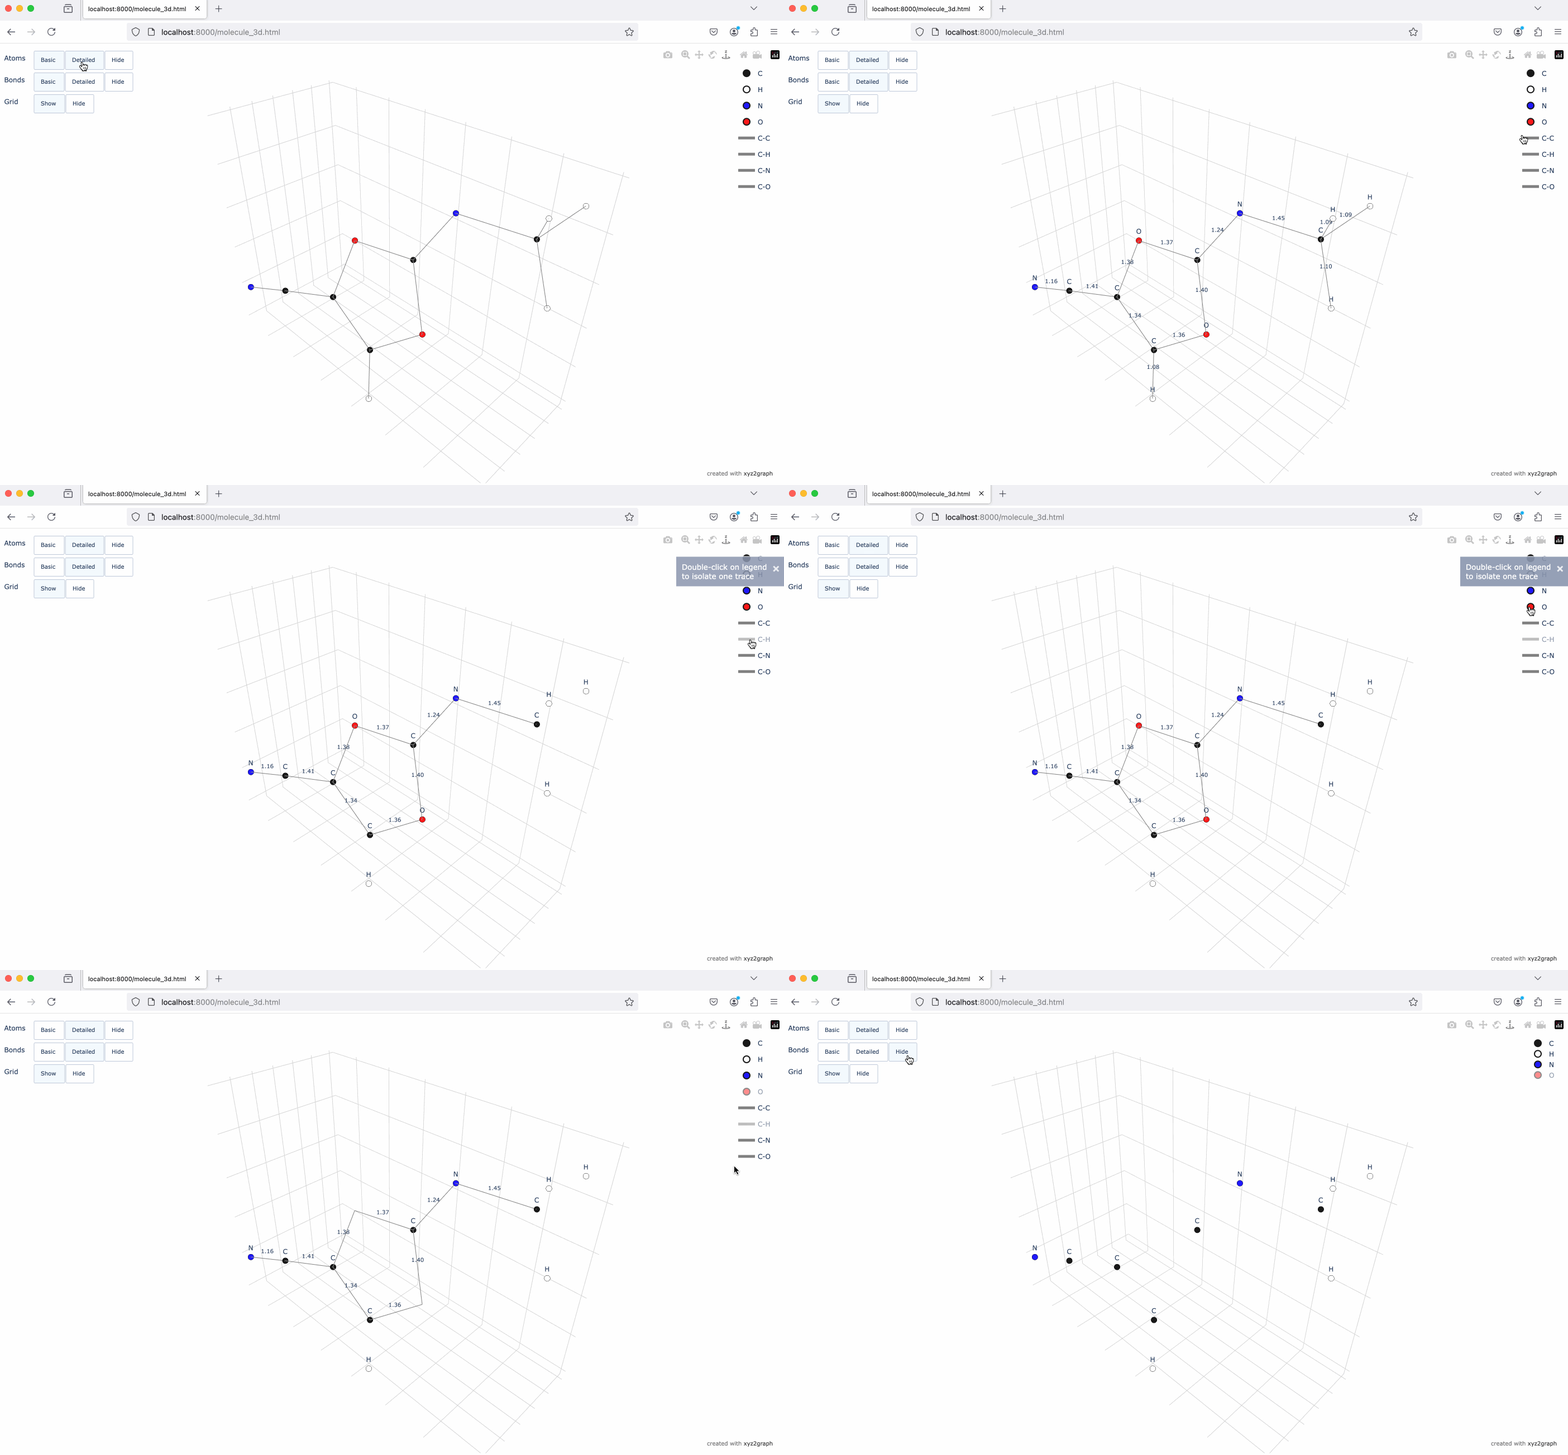
A Python package for converting XYZ molecular files into interactive 3D visualizations and NetworkX graphs.
- Interactive 3D molecular visualization using Plotly
- NetworkX graph conversion for analysis
- Command-line interface
pip install xyz2graph- Python 3.8+
- Dependencies: NumPy, Plotly, NetworkX
from xyz2graph import MolGraph

# Create molecular graph and read XYZ file
mg = MolGraph()
mg.read_xyz('molecule.xyz')

# Convert to NetworkX graph
G = mg.to_networkx()

# Generate interactive 3D visualization
fig = mg.to_plotly()
fig.show()# Save visualization as HTML
xyz2graph molecule.xyz
# Specify output file
xyz2graph molecule.xyz --output viz.html
# Open directly in browser
xyz2graph molecule.xyz --browser🪲 Report a bug
✨ Request a feature
Read the documentation for guides, API reference, and examples.
Contributions are welcome! Please see the Contributing Guide for guidelines.
If you use xyz2graph in your research, please cite:
@misc{zotko2018xyz2graph,
  author       = {Zotko, Mykola},
  title        = {xyz2graph: Molecular Structure Visualization},
  year         = {2018},
  publisher    = {GitHub},
  url          = {https://github.com/zotko/xyz2graph}
}


