PySCUBA stands for "Python for Single-cell Clustering Using Bifurcation Analysis".
PySCUBA is a novel computational method for extracting lineage relationships from single-cell genomics data, and modeling the dynamic changes associated with cell differentiation. PySCUBA draws from techniques in nonlinear dynamics and knowledge of stochastic differential equations to provide a systematic framework for modeling complex processes involving multi-lineage specifications.
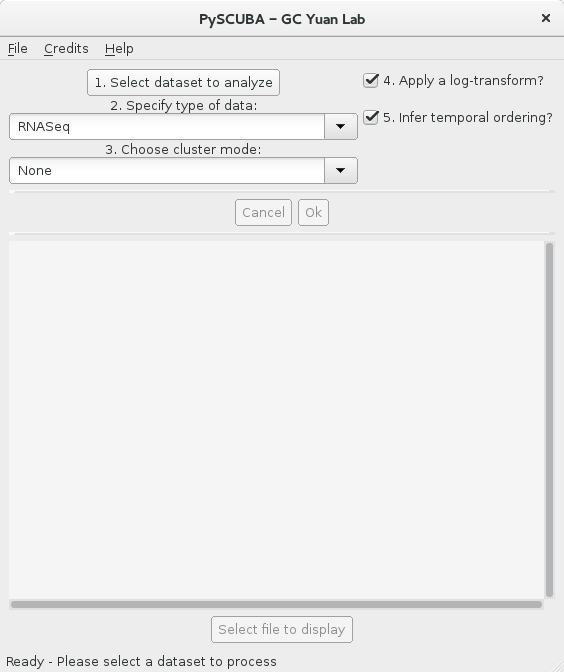
There is a MATLAB implementation of this method. However, PySCUBA is a complete overhaul and redesign, where some bugs, mathematical inconsistencies and improper handling of outlier cases have been taken care of. PySCUBA also comes with a GUI, written using the Python wrapper for the Qt framework:
PySCUBA is open source and can be used without the high licensing fees that were hampering some of our colleagues. Furthermore, PySCUBA is a much faster and more efficient way of handling the computations and data processing underlying the corresponding computational biology method. On a benchmark comparison, it was found that where the MATLAB code took about 20 minutes to complete, PySCUBA handles the same task in about 30 seconds.
PySCUBA is written in Python 2.7. It relies on the following libraries and APIs:
matplolib(1.4.3 or ulterior version)numpy(1.9.0 or later)Pillow(3.2.0 or later)PyQt4(at least version 4.11.4)python-igraph(version>=0.7.1)rpy2(2.8.1 or later)scipy(0.17.0 or later)setuptools(version>=21.0.0)sklearn(version>=0.17.1)Wand(version 0.4.3 or subsequent)
Most of those dependencies should be automatically resolved during an installation with pip, by
- starting a terminal;
- running
$ pip install PySCUBA.
Nonetheless, please ensure all those prerequisites have been met before proceeding any further. In particular, PyQt might have to be installed manually. In addition, note that you might need to run this using sudo depending on your Python installation.
In addition, you should have an up-to-date version of R in your environment, along with the princurve R package for principal curve analysis.
Alternatively, you can also get PySCUBA from source by downloading a tarball or zip archive from the corresponding GitHub page. Once you have downloaded and unpacked the source, navigate into the root source directory and run:
$ python setup.py install
In your terminal, run
$ PySCUBA
upon which a graphical user interface should pop up.
Select the file to process and choose the relevant data type and other such parameters. Detailed explanations for each of those options can be obtained by maintaining your cursor on a particular button; this includes format specifications for your dataset.
After your data has been subjected to various iterations of gap-statistics and penalized maximum likelihood estimations of the parameters of a Fokker-Planck potential, you will be prompted to choose various output files to display within the PySCUBA GUI. You can scroll up and down the display window, as well as zoom in and out.
A fully-functional, annotated example demonstrating a standard usage PySCUBA is provided herewith.
First of all, in a Python session, let us import a few modules. Pandas will prove quite convenient to fetch our example dataset:
from os import getcwd, path
import pandas as pd
The dataset in question is some qPCR data from Deng et al., "Single-cell RNA-seq reveals dynamic, random monoallelic gene expression in mammalian cells." Science. 2014 Jan 10;343(6167):193-6. It is accessible from a particular GitHub repository, whose url appears below. We want the content of that file, not its full GitHub view, which is why we use the Raw link to that repository and explains the lack of any blob/ in its url path:
url = 'https://raw.githubusercontent.com/gcyuan/SCUBA/master/sample_data/guo2010/guo2010Data.txt'
df = pd.read_csv(url, delimiter='\t')
Check that nothing untoward occurred by typing in
df.head()
We are now going to write this dataframe to a tab-separated *.txt file in your current working directory:
df.to_csv(path.join(getcwd(), 'super_duper_data.txt'), sep='\t', index=False)
In your terminal, we are now ready to launch the PySCUBA graphical user interface, which can be launched from any directory (not necessarily the one holding super_duper_data.txt):
$ PySCUBA
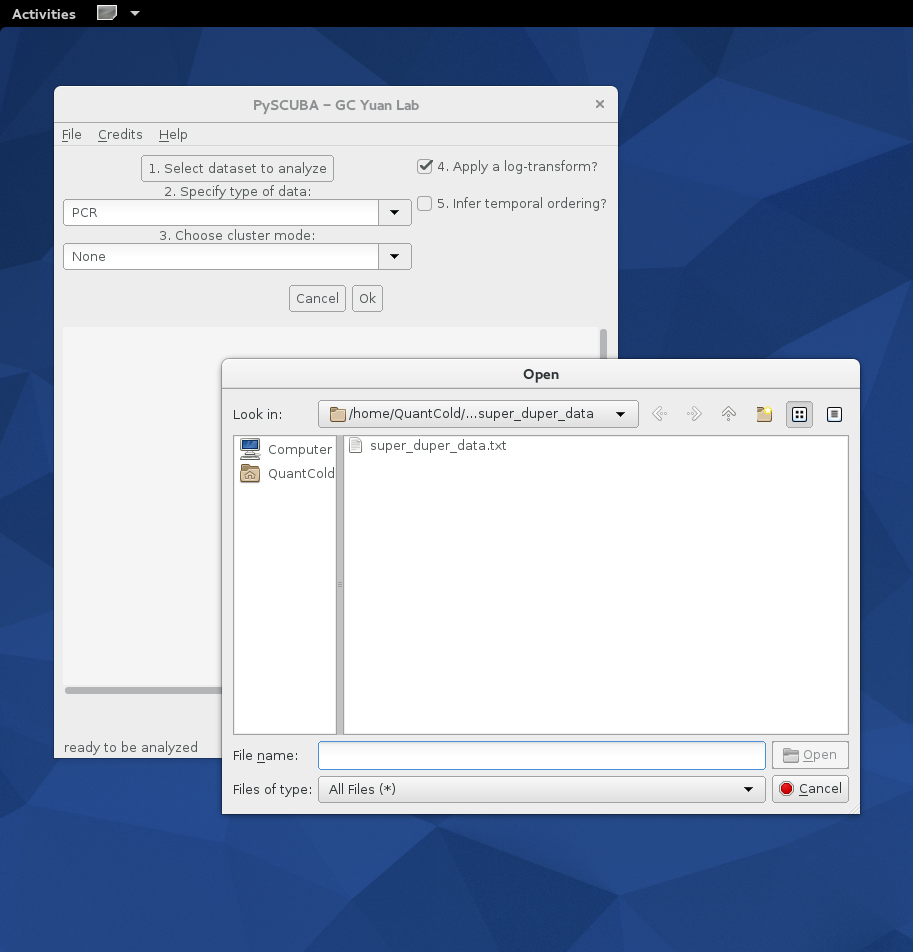
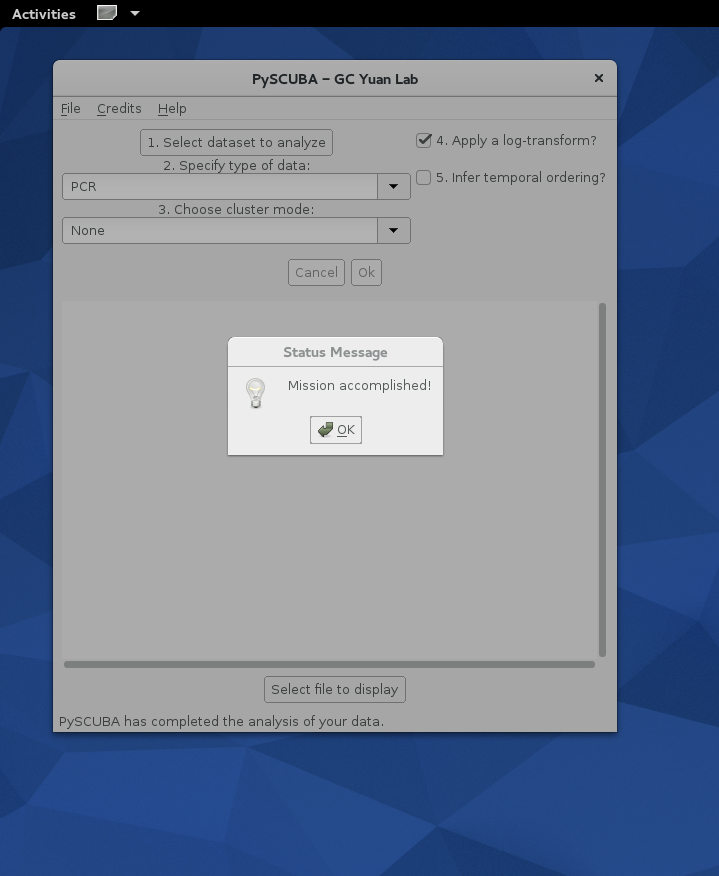
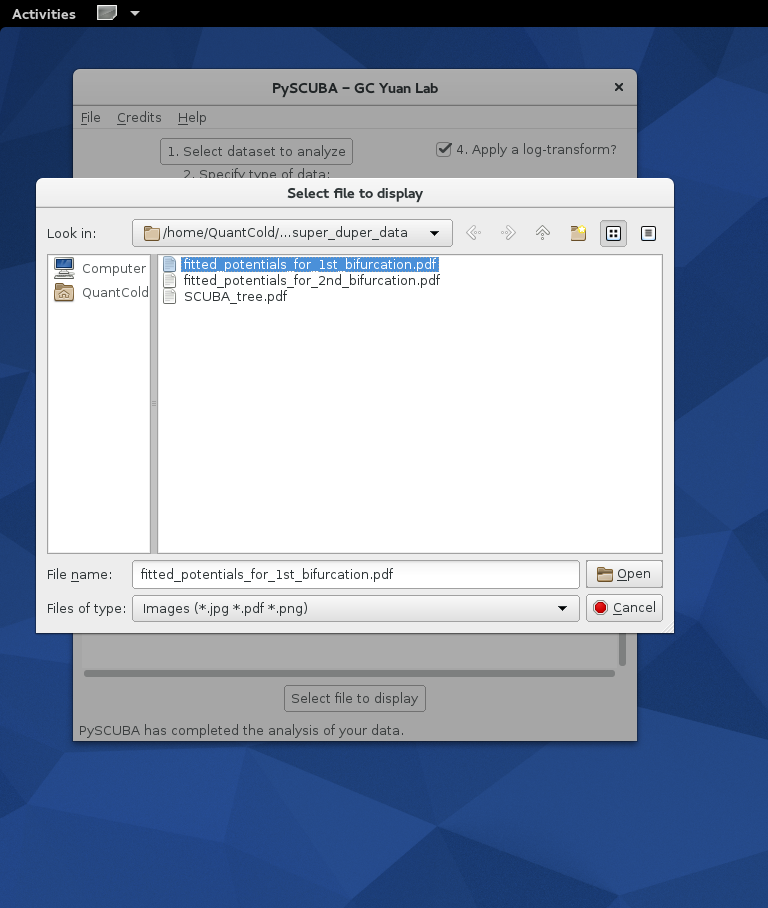
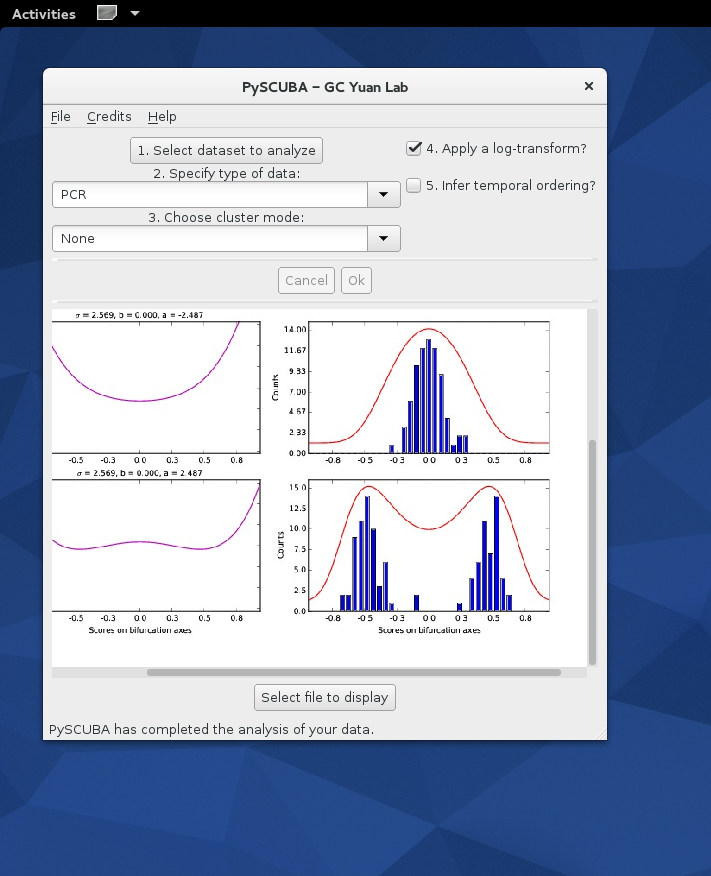
Below are a few screenshots illustrating how the PySCUBA GUI looks at start time, how to select super_duper_data.txt for processing and, once the dust settles down, how to select files for display and further investigations:
- Selecting a dataset:
- Message box arising upon completion of the various computations and MLE:
- Selecting a file to display within a GUI widget:
- Inspecting one of PySCUBA's output files (here, bifurcation histograms and fitted potentials):
If you find PySCUBA useful in your research, please cite its GitHub repository:
Giecold G, PySCUBA, (2016), GitHub repository, https://github.com/GGiecold/PySCUBA
The respective BibTex entry is
@misc{Giecold2016,
  author = {Giecold, G.},
  title = {PySCUBA},
  year = {2016},
  publisher = {GitHub},
  journal = {GitHub repository},
  howpublished = {\url{https://github.com/GGiecold/PySCUBA}},
  commit = {8ee6a08de15decdcdaf7d877888ae783832d80f2}
}
Besides, please cite the following reference as well:
Marco E, Karp RL, Guo G, Robson P, Hart AH, Trippa L, Yuan GC. (2014) "Bifurcation analysis of single-cell gene expression data reveals epigenetic landscape". Proceedings of the National Acacdemy of Sciences, 111, E5643-E5650.
Copyright 2016-2021 Gregory Giecold.
PySCUBA is free software made available under the MIT License. For details see the LICENSE file.
