Choose your language to read the introduction: English | 中文
Are you a beginner with Adobe Illustrator and want to master the methods of drawing illustrations for SCI papers? Our free tutorial series aims to guide you through actual cases to understand the basic operations of Adobe Illustrator and showcase its capabilities.
If you find this tutorial helpful, please click the ⭐ in the upper right corner and share it with others. Thank you for your support!
The main goal of this tutorial is to teach you how to draw high-quality scientific illustrations using Illustrator through practical examples. After learning from this tutorial, you will have a comprehensive understanding of Illustrator's basic operations and learn how to use its tools to draw various types of scientific illustrations. This tutorial not only explains Illustrator but also introduces methods of interaction with Adobe Photoshop, Microsoft PowerPoint, and Excel, enhancing your overall understanding of the scientific workflow.
The main content of this tutorial includes a detailed introduction to the basic operations of Adobe Illustrator and provides five cases, involving how to make scientific schematic diagrams, beautify Excel charts, draw geological maps, create technology roadmaps, and design neural network diagrams.
 |
 |
 |
|---|---|---|
 |
 |
 |
- Basic Operations: Understand the commonly used tools and basic operations of Adobe Illustrator.
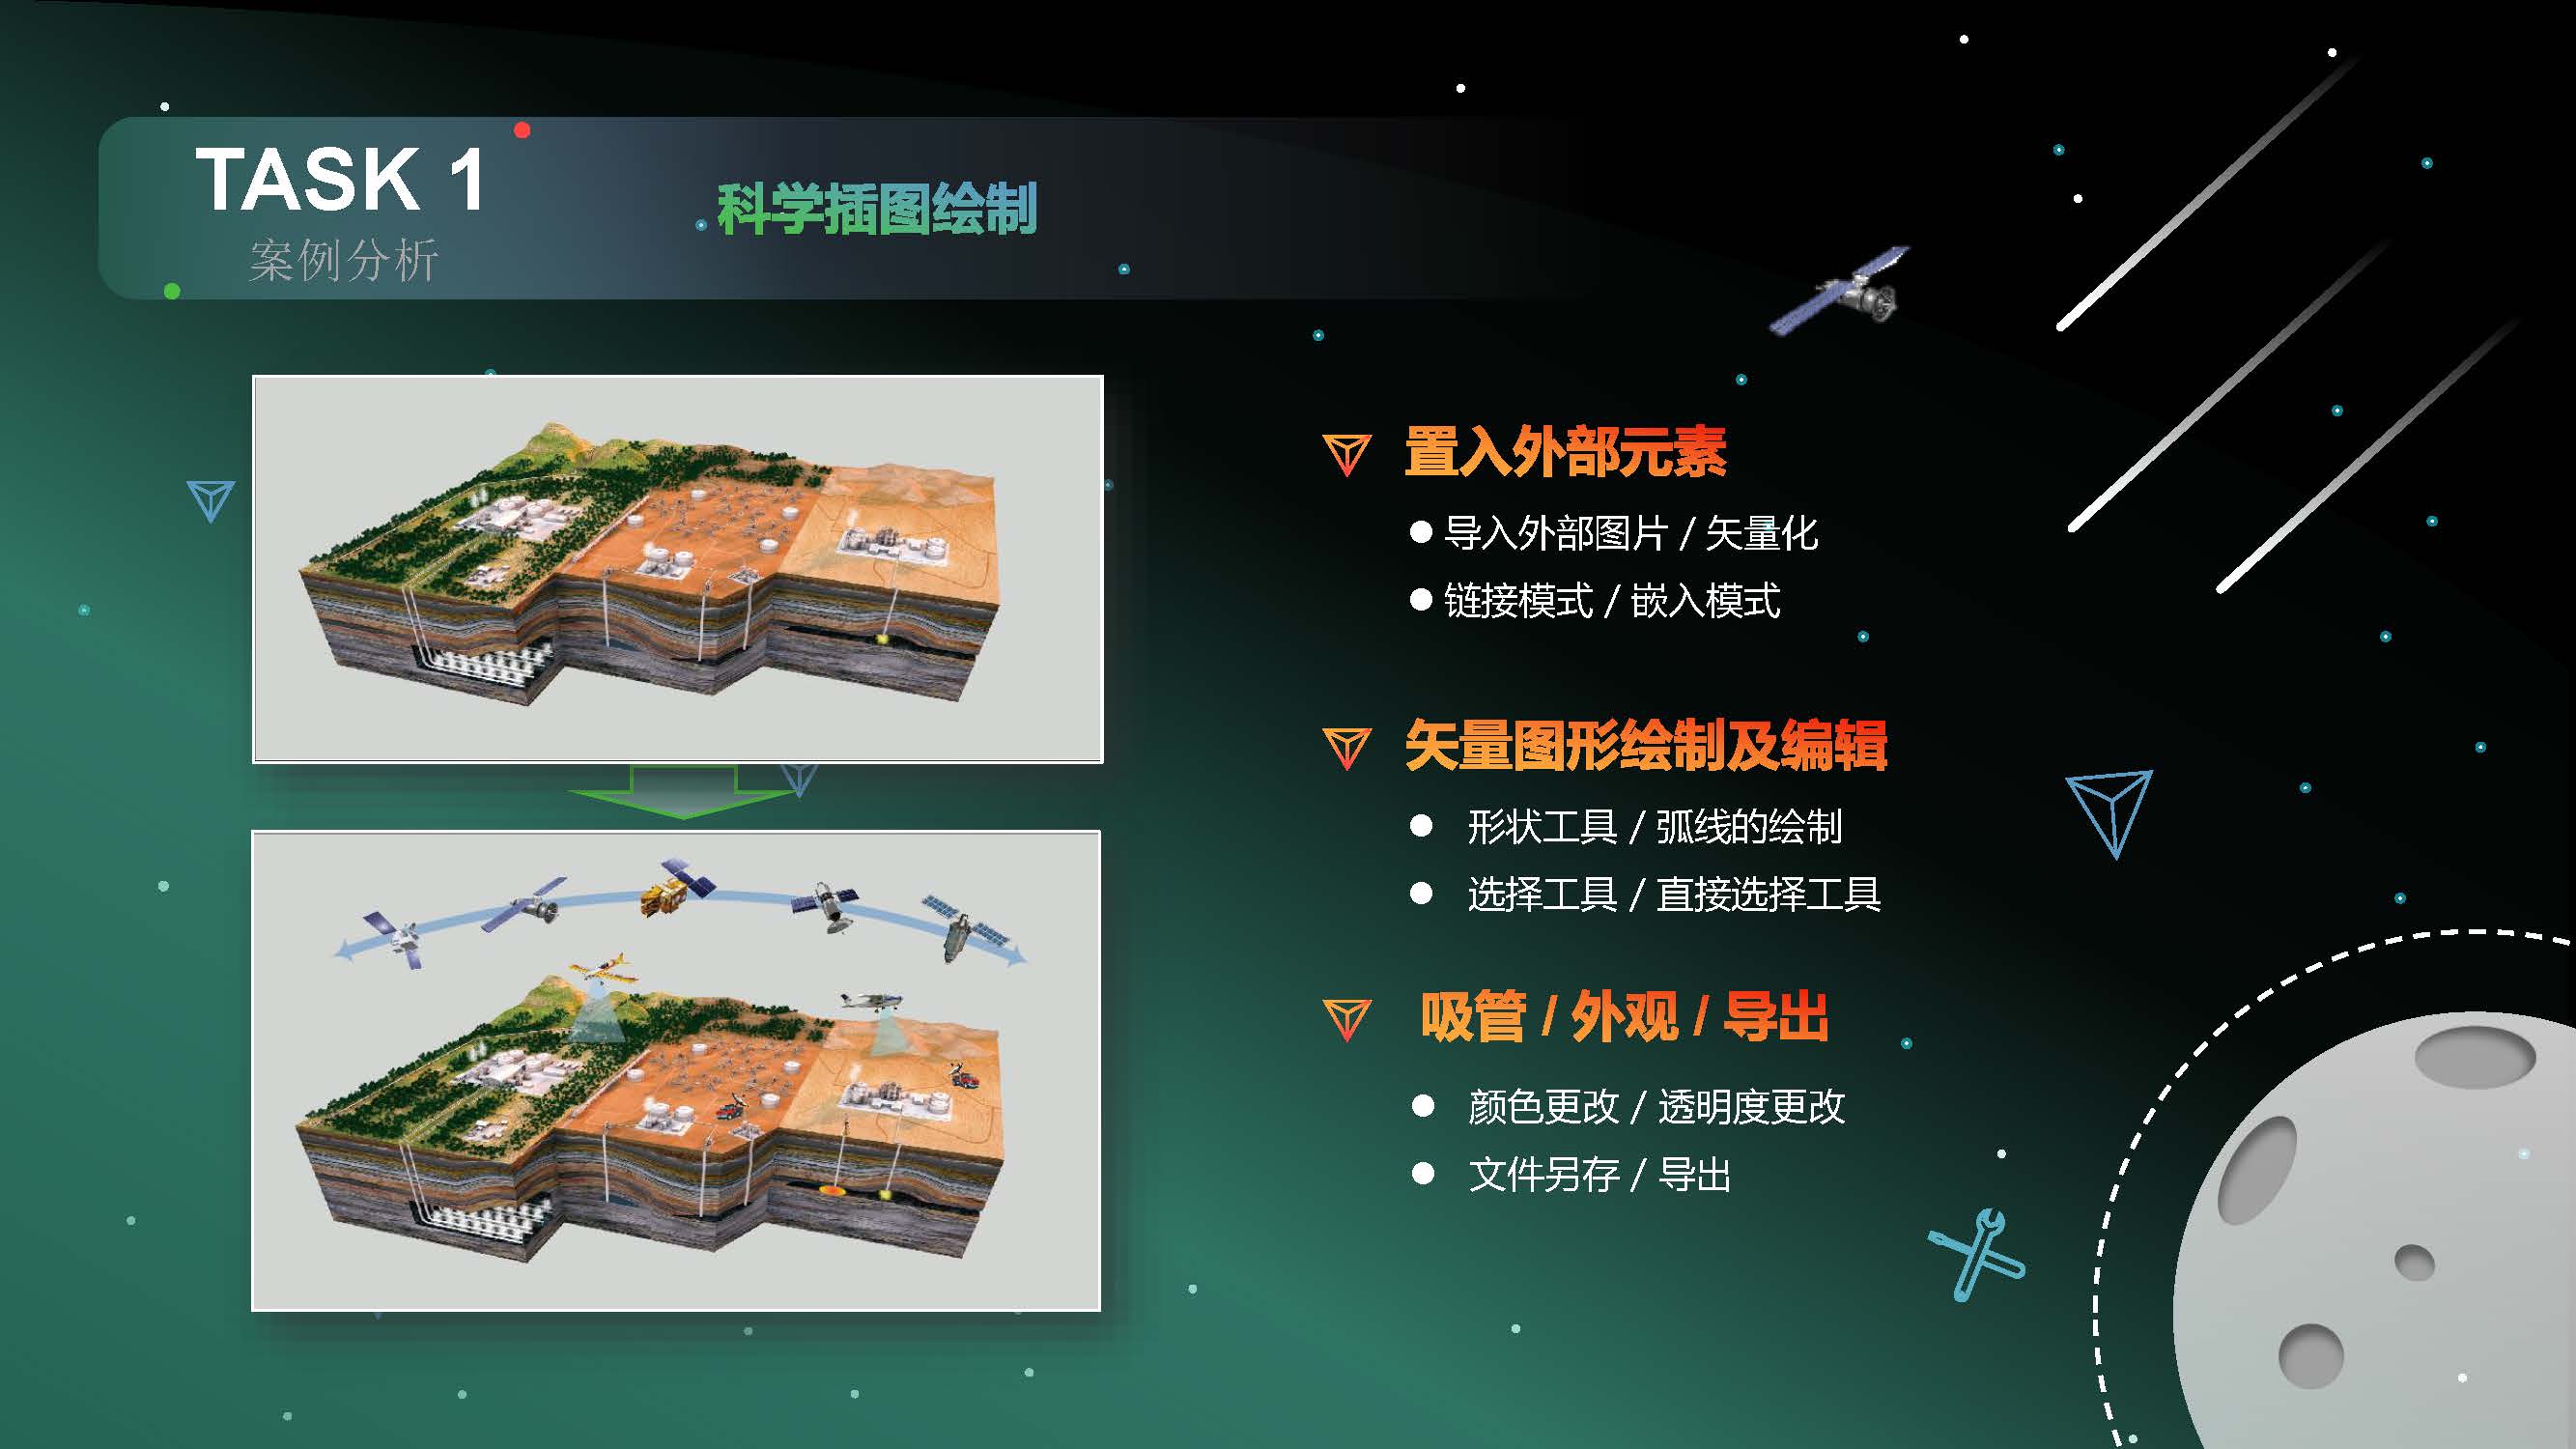
- Scientific Schematic Design: Learn to draw and edit vector graphics, and become familiar with the import and vectorization of bitmaps.
- Excel Chart Beautification: Learn to group/ungroup objects, edit text, and enhance Excel scatter plots.
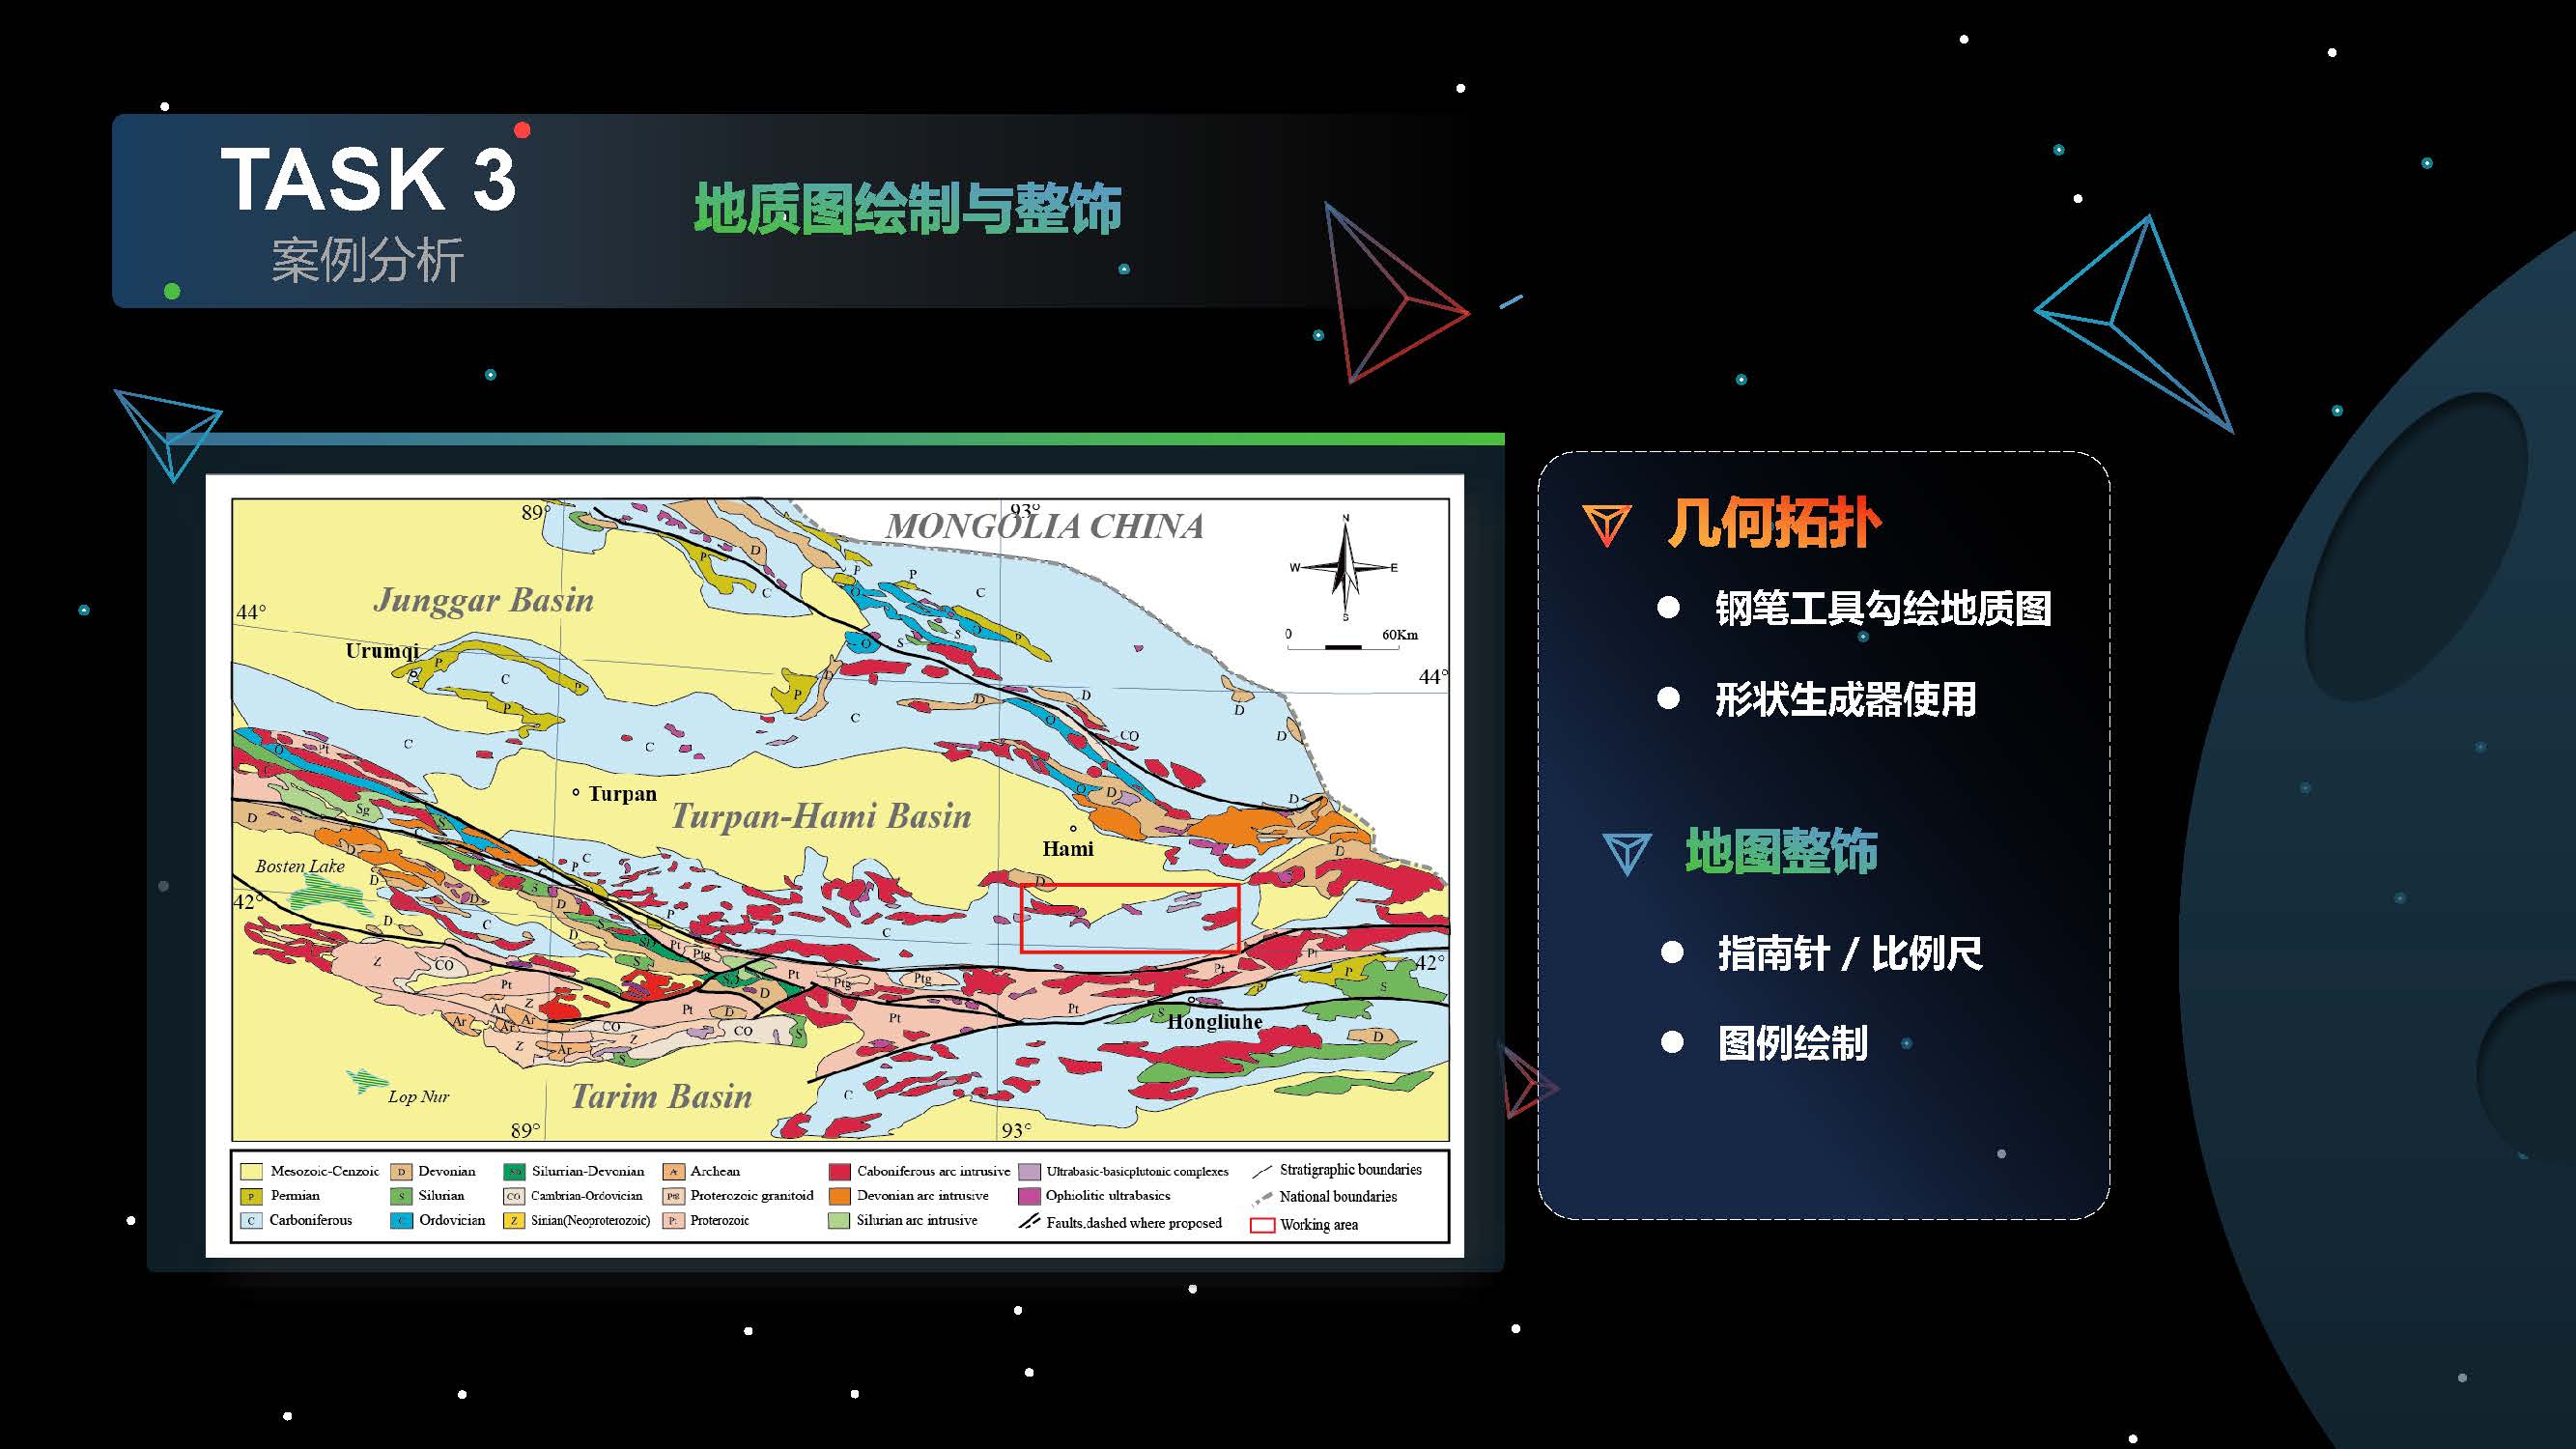
- Geological Map Drawing: Learn to use the Pen tool to draw map boundaries, and master geometric topology and map element embellishment.
- Technical Roadmap Drawing: Learn to draw technical roadmaps, and master methods of interaction with Adobe Photoshop and PowerPoint.
- Neural Network Diagram Design: Learn to draw 3D graphics and apply textures, understand color matching, and multi-layout output techniques.
This tutorial provides step-by-step teaching videos for each case, and the DEMO folder contains the learning materials required for the cases, making it convenient for you to replicate the cases during the learning process. In addition, we also provide a PDF introduction to this tutorial.
- Videos for Intro : Watch on Bilibili
- Videos for Task1: Watch on Bilibili
- Videos for Task2: Watch on Bilibili
- Videos for Task3: Watch on Bilibili
- Videos for Task4: Watch on Bilibili
- Videos for Task5: Watch on Bilibili