-
-
Notifications
You must be signed in to change notification settings - Fork 26
GDB Server
In this blog post, the GDB server of vAmiga is described as a feature preview. It's purpose is to inform about the upcoming functionality and to get feedback from potential users. The GDB server will be an official part of vAmiga 2.0 and can be tested with all upcoming beta builds.
We demonstrate the feature by debugging the following small C program that prints the series of prime numbers to the console:
#include <stdio.h>

int prime(int x)
{
    for (int y = 2; y < x; y++) {
        int rem = x % y;
        if (rem == 0) return 0;
    }
    return 1;
}

int main(int argc, char *argv[])
{
    int n = 2;
    while (n) {
        if (prime(n)) {
            printf("%d is a prime number\n", n);
        }
        n++
    }
}
To debug the program in vAmiga, we have to compile it into an Amiga executable first. This can be done easily by using the AmigaOS port of the GCC Compiler Collection by Stefan Franke. For the rest of the article we assume the compiler collection has been installed on your machine. E.g., after compiling the collection on macOS with default settings, you should be able to spot the generated binaries in the following directory:
/opt/amiga/bin
Besides others, this directory contains the following two programs:
m68k-amigaos-gcc
m68k-amigaos-gdb
The first program allows us to compile the test program into an Amiga EXE file:
m68k-amigaos-gcc prime.c -g -mcrt=nix13 -o prime.exe
Option -g instructs the compiler to generate debug information. Option -mcrt=nix13 is needed because we want to run the program on a virtual Amiga with Kickstart 1.3. If everything works as expected, an Amiga executable called prime.exe has been created.
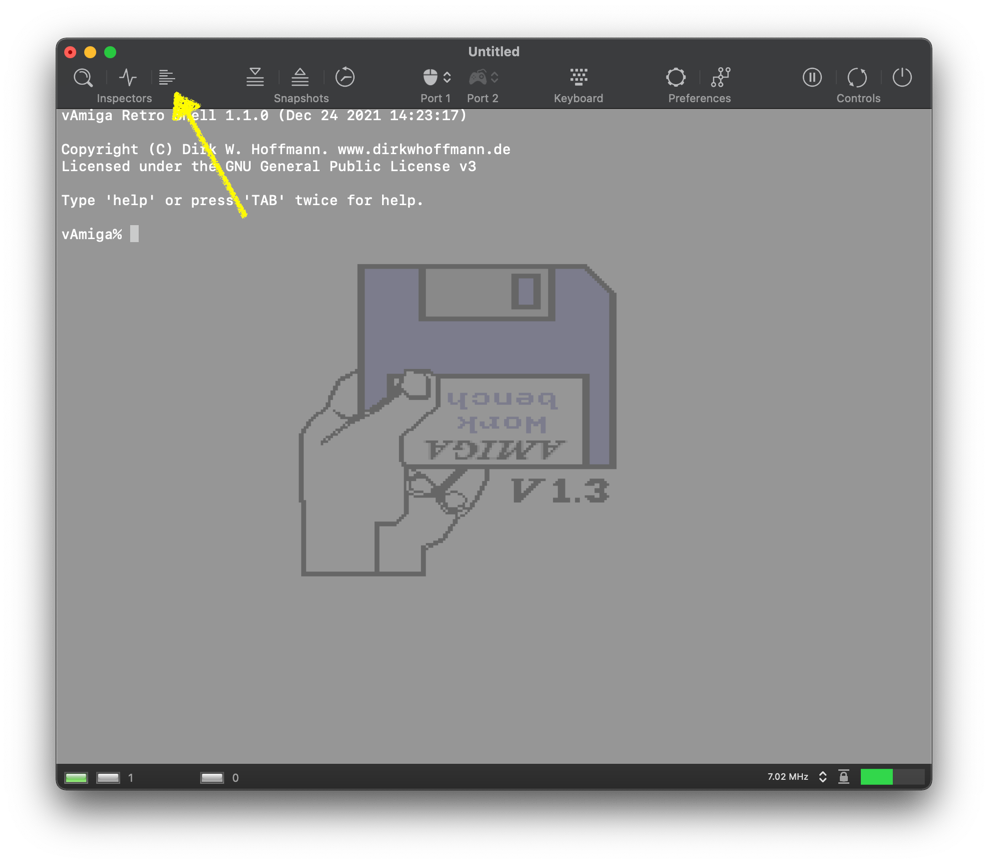
Next, we start vAmiga and click on the following toolbar icon to open the retro shell:
Retro shell is the debug console of vAmiga. It provides a simple but powerful command line interface to control the emulator. In vAmiga 2.0, a rudimentary GDB server can be activated within the console. The server allows an instance of GDB to connect to the emulator via a socket connection. To activate the server, type in the following command:
vAmiga% server gdb attach file
Waiting for process 'file' to launch.
This command tells the GDB server to attach to a process named 'file'. Later, when our compiled program will be loaded in vAmiga, file will be the name of the process that belongs to our sample program. At the moment, this process does not yet exist. The server is still inactive which means that it does not allow any client to connect yet. However, a launch daemon is running silently in the background observing the AmigaOS process list. Once the process is found, the launch daemon will start the GDB server for us.
Next we load our compiled program into vAmiga. The easiest way to do so is to drag and drop the EXE file into the emulator. In this case, vAmiga automatically converts the EXE file into a bootable ADF. It also generates a startup-sequence that automatically loads the EXE file. Please note the current ADF creator renames the dragged in executable to file to avoid naming issues. This is reason why we had to specify file as the process name above.
Now we have to wait a few seconds for the program to load. Shortly after the program has started, the pending GDB server wakes up and attaches to the previously specified process:
From now on the GDB server is ready to accept external connections on port 8082. At this point, we can start GDB on our host operating system:
m68k-amigaos-gdb prime.exe
After hitting return, the GNU debugger comes up:
GNU gdb (GDB) 10.0.50.211207-144216-git
Copyright (C) 2020 Free Software Foundation, Inc.
...
Reading symbols from prime.exe...
(gdb)
Now we can connect to vAmiga's GDB server with the target remote command:
(gdb) target remote :8082
Remote debugging using :8082
warning: Target reported unsupported offsets: Text=00c08728;Data=00c0b060;Bss=00c0b1e0
0x00fc81ec in ?? ()
(gdb)
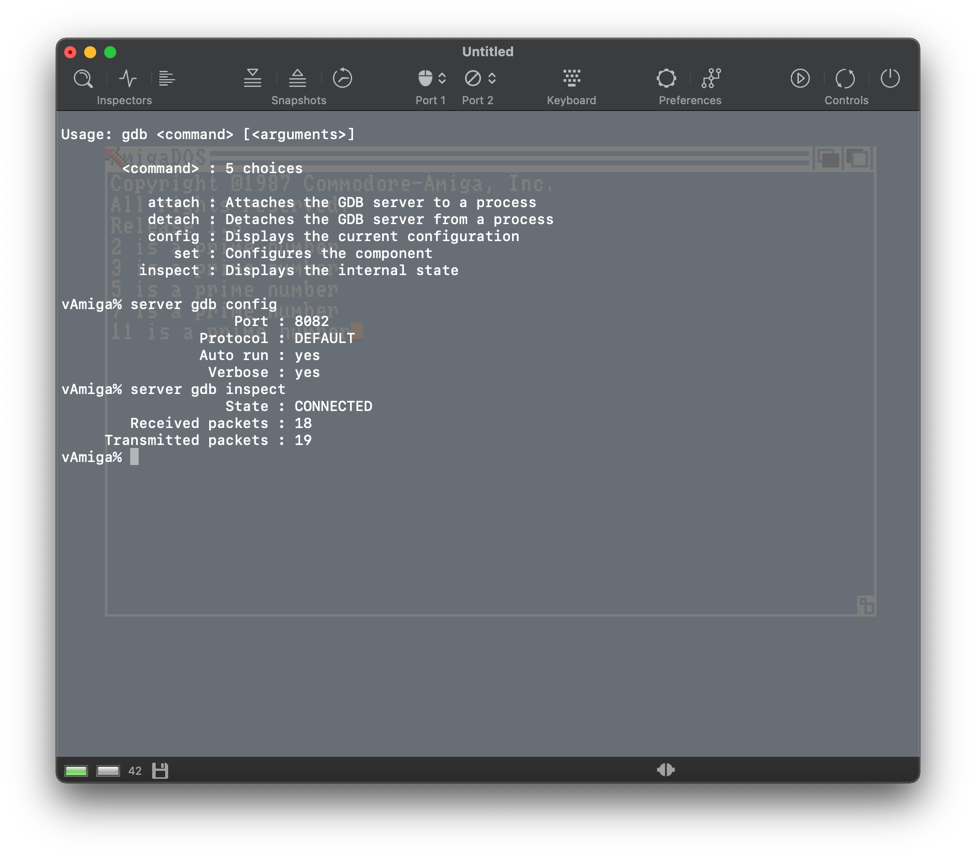
On the emulator side, we can check the connection status by typing in
server gdb inspect
This command displays some status information about the current server state as well as a small statistics about the number of packages that have been sent back and forth over the socket connection so far.
In our example, the server is now in CONNECTED state which means that a stable connection with the GDB client has been established. The connection state is also indicated by a small icon in the status bar. As you might have already noticed, this icon has changed several times by now. Besides the off state in which no icon is displayed, four different server states can be distinguished:
From left to right:
- The server is waiting for the debug process to launch.
- The server is ready and waiting for a client to connect.
- The server is connected to a client.
- The server has encountered a connection error.
The error state icon should never be displayed for a longer amount of time. If an error occurs, vAmiga is supposed to disconnect the client and either shut the server down or put it back into one of the non-error states.
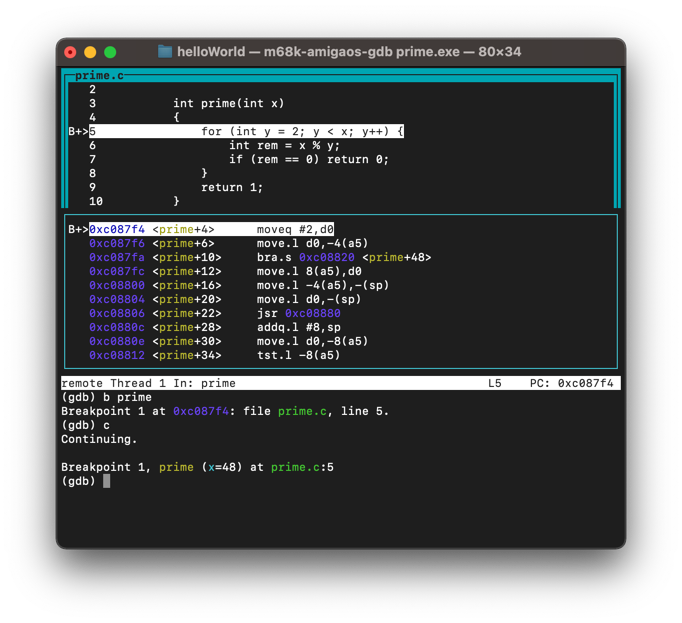
From now on we can debug the program in GDB. By issuing the following, we advice GDB to switch to split view with the 'layout' command, set a breakpoint with the 'b' command, and continue emulation with the 'c' command:
layout split
b prime
c
Emulation continues until the breakpoint has been hit:
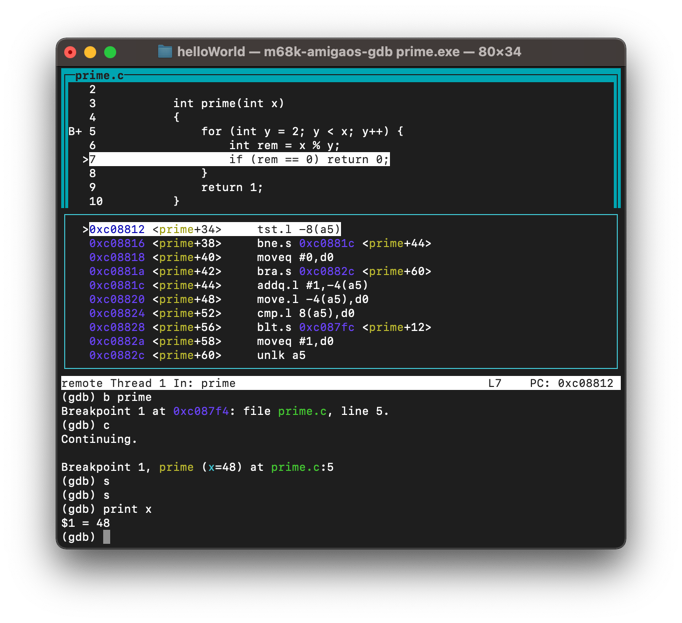
Now we can single-step through our program with the s command, or inspect the values of variables with the print command:
Please note that m68k-amigaos-gdb has some limitations w.r.t. to variable inspection. With the version used in this demonstration, only local variables and function parameters can be analysed.
vAmiga's GDB server is in a very early stage at the moment. It is meant to be a proof-of-concept implemention instead of a productive tool. In fact, only a few protocol commands are supported yet which means that it is not possible to use all GDB features at the time of writing this blog post. As always, bug reports are highly appreciated. I also welcome all developers who want to extend the functionality or to connect vAmiga to their own debugging front-ends. To get an impression about the implementation, potential developers are advised to have a look at the following file where the handlers of all supported commands of the GDB serial protocol are implemented:
/Emulator/Misc/RemoteServers/GdbServerCmds.cpp


