AudioOwl is using librosa and RNN models to run fast analysis of music files 🎸.
Jump to:
Mix your music automatically with MixingBear - Automatic beat-mixing of music files 🎚
Analyze a WAV audio file -
import audioowl
data = audioowl.analyze_file(path='my_music_file.wav', sr=22050)

print (data)
==> {'sample_rate': 22050,
    'duration': 36.096009070294784,
    'beat_samples': [12794, 40148, 66179, 93092, ...,
    'notes': [2,2,2,2,3,3,3,1,1,...]
    ...}
or an MP3 file -
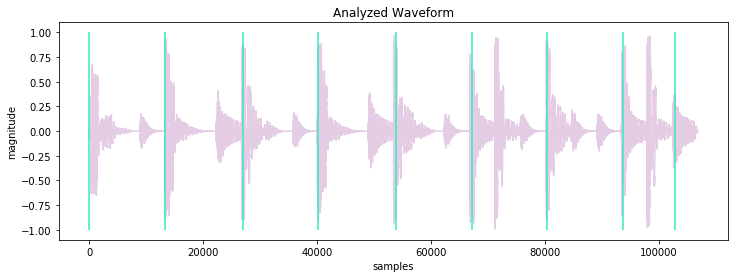
data = audioowl.analyze_file(path='my_music_file.mp3', sr=22050)Get beat times in samples (data['beat_samples']) -
import matplotlib.pyplot as plt

waveform = audioowl.get_waveform('drums.mp3', sr=22050)
data = audioowl.analyze_file('drums.mp3', sr=22050)

plt.figure()
plt.vlines(data['beat_samples'], -1.0, 1.0)
plt.plot(waveform)
plt.show()Tested on Python 3.6 or later
⚠️ AudioOwl needs ffmpeg to be installed on your machine. The easiest way to install ffmpeg (at least on a Mac) is using homebrew. See instructions here.
The latest stable release is available on PyPI.
Install it using the following command -
$ pip install audioowlGiven an audio file, AudioOwl generates an objects with many useful information about your file 💪.
Returns a numpy array that contains that audio file time series.
Supported keyword arguments for audioowl.get_waveform():
path- Local path to the audio file.sr[optional] - Requested sample rate for the analyzed file. This does not have to be the actual sample rate of the file, but the sample rate that will be used for the analysis. default = 22050.
Returns an object (dictionary) with the analysis results.
The audioowl.analyze_file() function allows you to use the path to the audio file.
Supported keyword arguments for audioowl.analyze_file():
path- Local path to the audio file.sr[optional] - Requested sample rate for the analyzed file. This does not have to be the actual sample rate of the file, but the sample rate that will be used for the analysis. default = 22050.
Returns a numpy array that contains that audio file time series.
The audioowl.analyze_samples() function allows you to use an audio time series (as numpy array).
Example -
import audioowl

time_series = audioowl.get_waveform('my_music_file.wav')
data = audioowl.analyze_samples(y=time_series, sr=44100)
Supported keyword arguments for audioowl.analyze_samples():
y- Time series. Must be a numpy array, with shape (1,) for mono, and (2,) for stereo.sr- Requested sample rate for the analyzed file. This does not have to be the actual sample rate of the file, but the sample rate that will be used for the analysis.
The return value of all function is a an object (dictionary) with the analysis results.
In case where the return value is stored in data:
import audioowl
data = audioowl.analyze_file(path='my_music_file.wav', sr=22050)
The data object will include the following properties:
  data['sample_rate'] # [int] sample rate

  data['duration'] # [float] file duration

  data['beat_samples'] # [list] beat location in samples

  data['number_of_beats'] # [list] number of detected beats

  data['tempo_float'] # [float] detected tempo as a float

  data['tempo_int'] # [int] detected tempo as an int

  data['zero_crossing'] # [list] detected zero level crossing, in samples detected

  data['noisiness_median'] # [float] nosiness value as a median, across the file

  data['noisiness_sum'] # [float] nosiness value as a sum, across the file

  data['notes'] # [list] notes across the file, based on chromagram of hop_length=512 samples.
  # notes legend:
  # 0   c
  # 1   c#
  # 2   d
  # 3   d#
  # 4   e
  # 5   f
  # 6   f#
  # 7   g
  # 8   g#
  # 9   a
  # 10  a#
  # 11  b

  data['dominant_note'] # [int] most dominant (frequent) note across the file


