- Pull the all related docker images :
docker pull docker.elastic.co/elasticsearch/elasticsearch:8.13.4
docker pull docker.elastic.co/kibana/kibana:8.13.4
docker pull docker.elastic.co/logstash/logstash:8.13.4- Write the Docker Compose file :
version: '3.7'

services:

  # The 'setup' service runs a one-off script which initializes users inside
  # Elasticsearch — such as 'logstash_internal' and 'kibana_system' — with the
  # values of the passwords defined in the '.env' file. It also creates the
  # roles required by some of these users.
  #
  # This task only needs to be performed once, during the *initial* startup of
  # the stack. Any subsequent run will reset the passwords of existing users to
  # the values defined inside the '.env' file, and the built-in roles to their
  # default permissions.
  #
  # By default, it is excluded from the services started by 'docker compose up'
  # due to the non-default profile it belongs to. To run it, either provide the
  # '--profile=setup' CLI flag to Compose commands, or "up" the service by name
  # such as 'docker compose up setup'.

  setup:
    profiles:
      - setup
    build:
      context: setup/
      args:
        ELASTIC_VERSION: ${ELASTIC_VERSION}
    init: true
    volumes:
      - ./setup/entrypoint.sh:/entrypoint.sh:ro,Z
      - ./setup/lib.sh:/lib.sh:ro,Z
      - ./setup/roles:/roles:ro,Z
    environment:
      ELASTIC_PASSWORD: ${ELASTIC_PASSWORD:-}
      LOGSTASH_INTERNAL_PASSWORD: ${LOGSTASH_INTERNAL_PASSWORD:-}
      KIBANA_SYSTEM_PASSWORD: ${KIBANA_SYSTEM_PASSWORD:-}
      METRICBEAT_INTERNAL_PASSWORD: ${METRICBEAT_INTERNAL_PASSWORD:-}
      FILEBEAT_INTERNAL_PASSWORD: ${FILEBEAT_INTERNAL_PASSWORD:-}
      HEARTBEAT_INTERNAL_PASSWORD: ${HEARTBEAT_INTERNAL_PASSWORD:-}
      MONITORING_INTERNAL_PASSWORD: ${MONITORING_INTERNAL_PASSWORD:-}
      BEATS_SYSTEM_PASSWORD: ${BEATS_SYSTEM_PASSWORD:-}
    networks:
      - elk
    depends_on:
      - elasticsearch

  elasticsearch:
    build:
      context: elasticsearch/
      args:
        ELASTIC_VERSION: ${ELASTIC_VERSION}
    volumes:
      #- ./elasticsearch/config/elasticsearch.yml:/usr/share/elasticsearch/config/elasticsearch.yml:ro,Z
      - elasticsearch:/usr/share/elasticsearch/data:Z
    ports:
      - 9200:9200
      - 9300:9300
    environment:
      node.name: elasticsearch
      ES_JAVA_OPTS: -Xms512m -Xmx512m
      # Bootstrap password.
      # Used to initialize the keystore during the initial startup of
      # Elasticsearch. Ignored on subsequent runs.
      ELASTIC_PASSWORD: ${ELASTIC_PASSWORD:-}
      # Use single node discovery in order to disable production mode and avoid bootstrap checks.
      # see: https://www.elastic.co/guide/en/elasticsearch/reference/current/bootstrap-checks.html
      discovery.type: single-node
    networks:
      - elk
    restart: unless-stopped

  logstash:
    build:
      context: logstash/
      args:
        ELASTIC_VERSION: ${ELASTIC_VERSION}
    volumes:
      #- ./logstash/config/logstash.yml:/usr/share/logstash/config/logstash.yml:ro,Z
      - ./logstash/pipeline:/usr/share/logstash/pipeline:ro,Z
    ports:
      - 5044:5044
      - 50000:50000/tcp
      - 50000:50000/udp
      - 9600:9600
    environment:
      LS_JAVA_OPTS: -Xms256m -Xmx256m
      LOGSTASH_INTERNAL_PASSWORD: ${LOGSTASH_INTERNAL_PASSWORD:-}
    networks:
      - elk
    depends_on:
      - elasticsearch
    restart: unless-stopped

  kibana:
    build:
      context: kibana/
      args:
        ELASTIC_VERSION: ${ELASTIC_VERSION}
    #volumes:
    #  - ./kibana/config/kibana.yml:/usr/share/kibana/config/kibana.yml:ro,Z
    ports:
      - 5601:5601
    environment:
      KIBANA_SYSTEM_PASSWORD: ${KIBANA_SYSTEM_PASSWORD:-}
    networks:
      - elk
    depends_on:
      - elasticsearch
    restart: unless-stopped

networks:
  elk:
    driver: bridge

volumes:
  elasticsearch:
- Start your deployment without 'Setup' service (manual deployment) :
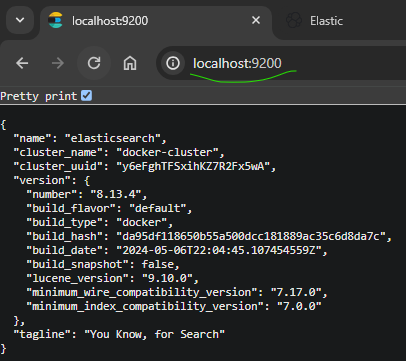
docker compose up- Test the Elastic node via browser :
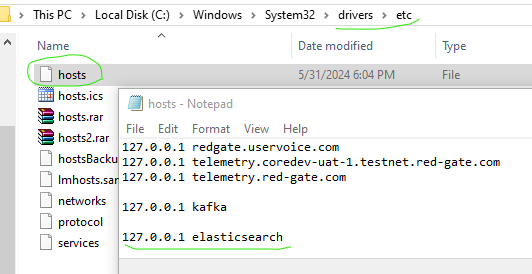
- Add elasticsearch DNS A record within etc/hosts :
- On the elasticsearch node, write the below command :
bin/elasticsearch-reset-password -u kibana_system --auto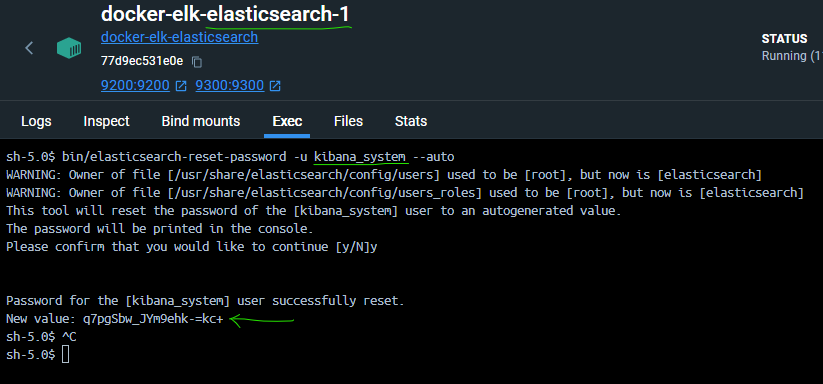
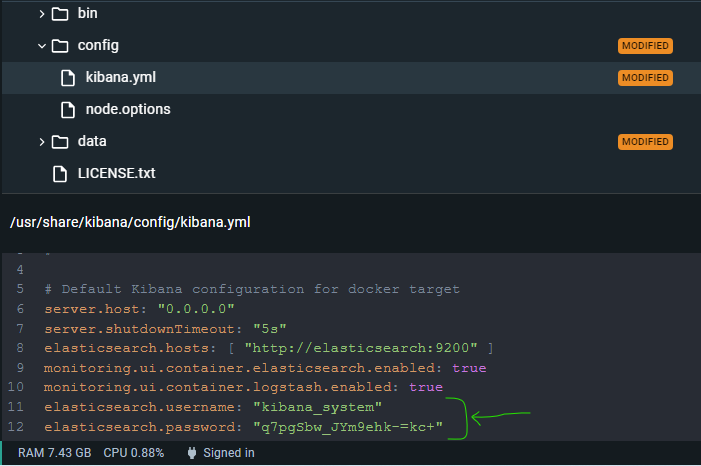
- And copy the New Value result to the kibana node and kibana.yml :
elasticsearch.username: "kibana_system"
elasticsearch.password: "q7pgSbw_JYm9ehk-=kc+"
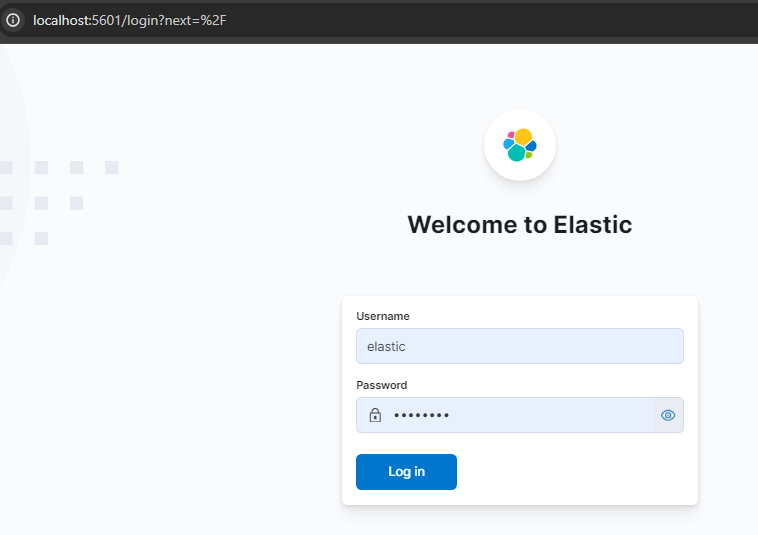
- And go to the kibana portal :
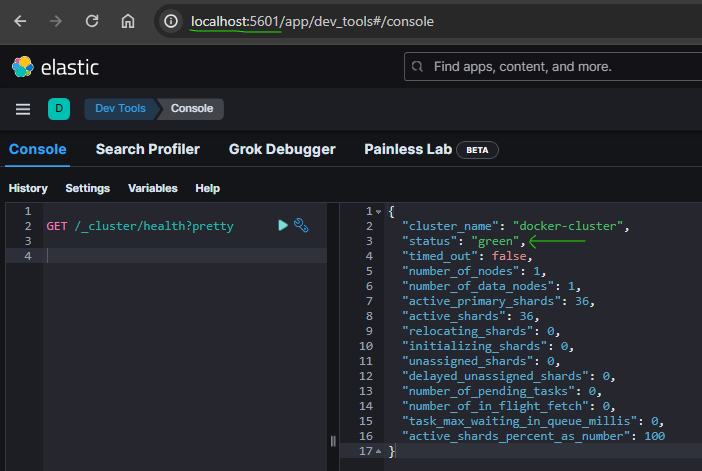
- Get the elastic node healthy info from kibana :
GET /_cluster/health?pretty
- On the elasticsearch node, write the below command :
bin/elasticsearch-reset-password -u logstash_system --auto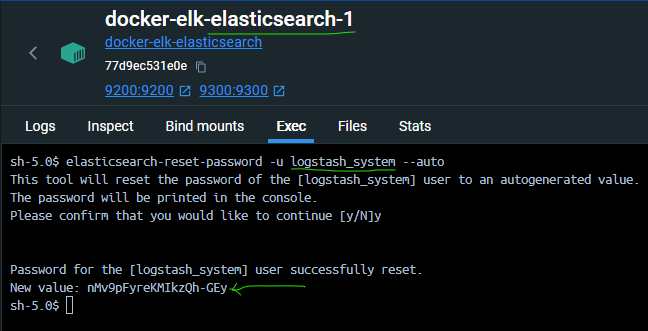
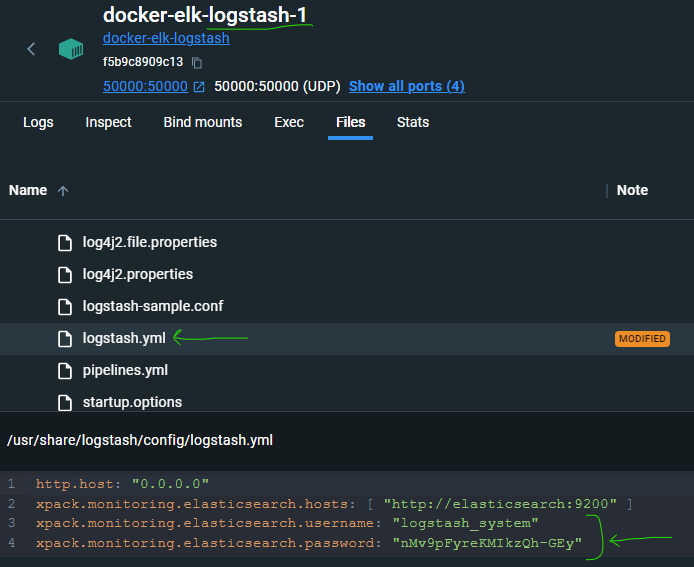
- Copy the New Value result to the logstash node and logstash.yml :
xpack.monitoring.elasticsearch.username: "logstash_system"
xpack.monitoring.elasticsearch.password: "nMv9pFyreKMIkzQh-GEy"
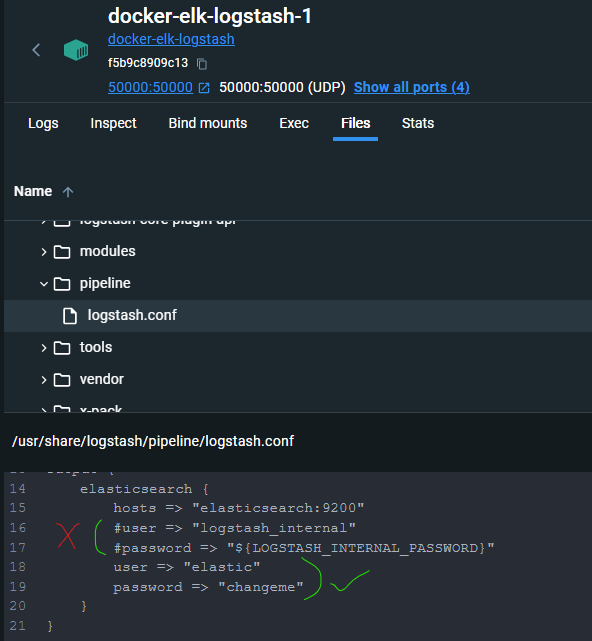
- Then change the elastic node auth info in the logstash.conf :
output {
	elasticsearch {
		hosts => "elasticsearch:9200"
		#user => "logstash_internal"
		#password => "${LOGSTASH_INTERNAL_PASSWORD}"
		user => "elastic"
		password => "changeme"
	}
}
- Check the logstash log :
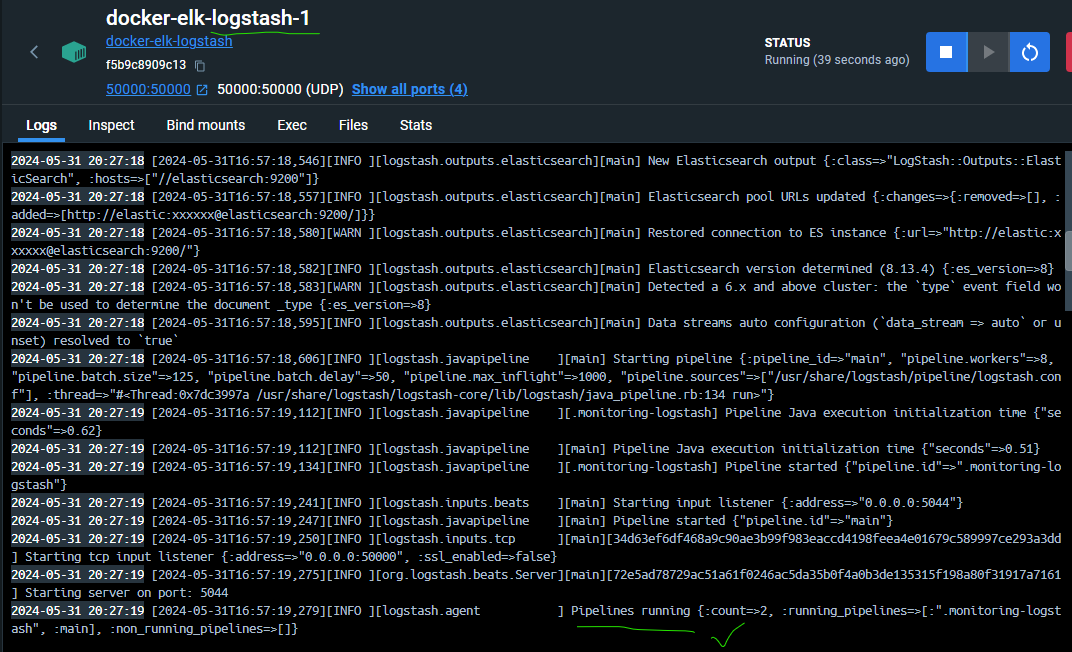
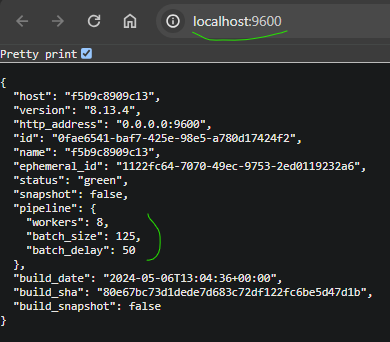
- And logstash info :
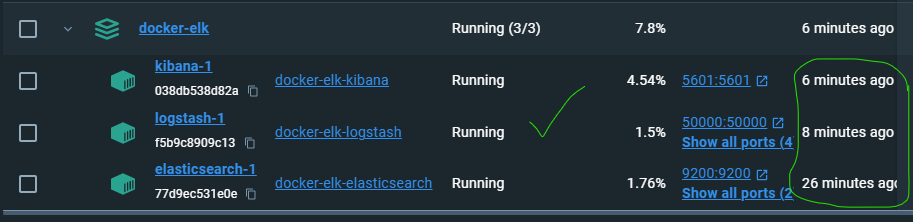
- And the docker desktop shows that stack is healthy :
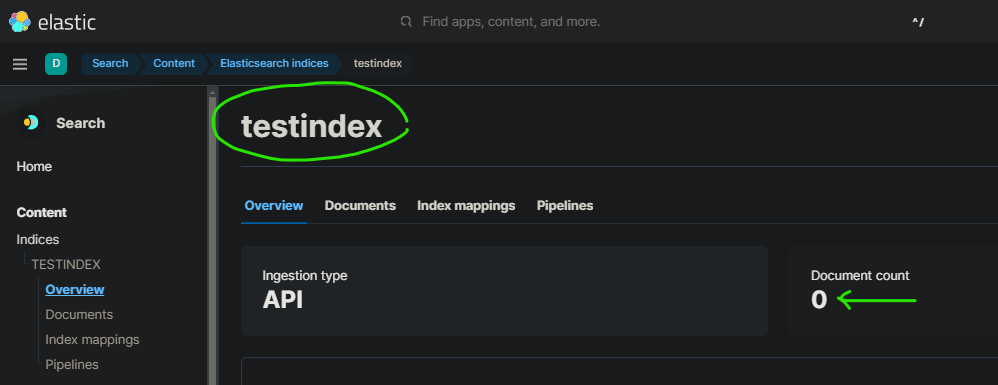
- Create your index named testindex in elasticsearch via kibana :
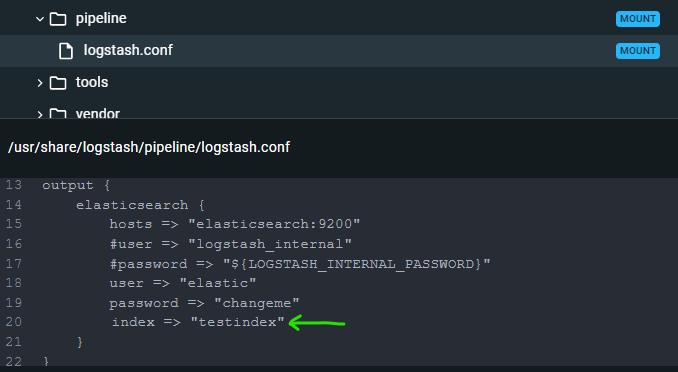
- Add below lines at logstash.conf :
output {
	elasticsearch {
		hosts => "elasticsearch:9200"
		#user => "logstash_internal"
		#password => "${LOGSTASH_INTERNAL_PASSWORD}"
		user => "elastic"
		password => "changeme"
        	index => "testindex"
	}
}
- Write some python scripts or C# code for sending data to the related port (50000) :
import socket
import sys

HOST = '192.168.1.4'
PORT = 50000

try:
  sock = socket.socket(socket.AF_INET, socket.SOCK_STREAM)
except socket.error as msg:
  sys.stderr.write("[ERROR] %s\n" % msg[1])
  sys.exit(1)

try:
  sock.connect((HOST, PORT))
except socket.error as msg:
  sys.stderr.write("[ERROR] %s\n" % msg[1])
  sys.exit(2)

msg = '{"id":"1","name":"kayvan soleimani","email":"kayvan.sol2@gmail.com}'

sock.send(msg.encode('utf-8') )

sock.close()
sys.exit(0)
C# Code :
using System;
using System.Net.Sockets;
using System.Text;
string HOST = "192.168.1.4";
int PORT = 50000;
try
{
using (Socket sock = new Socket(AddressFamily.InterNetwork, SocketType.Stream, ProtocolType.Tcp))
{
sock.Connect(HOST, PORT);
string msg = "{\"id\":\"2\",\"name\":\"Sorayya Asadi\",\"email\":\"sorayyaasadi6@gmail.com\"}";
byte[] data = Encoding.UTF8.GetBytes(msg);
sock.Send(data);
Console.WriteLine("Data sent to logstash ...");
}
}
catch (SocketException ex)
{
Console.Error.WriteLine($"[ERROR] {ex.Message}");
Environment.Exit(1);
}
catch (Exception ex)
{
Console.Error.WriteLine($"[ERROR] {ex.Message}");
Environment.Exit(2);
}
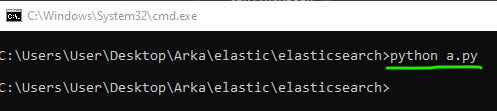
Console.ReadLine();Then run the python script :
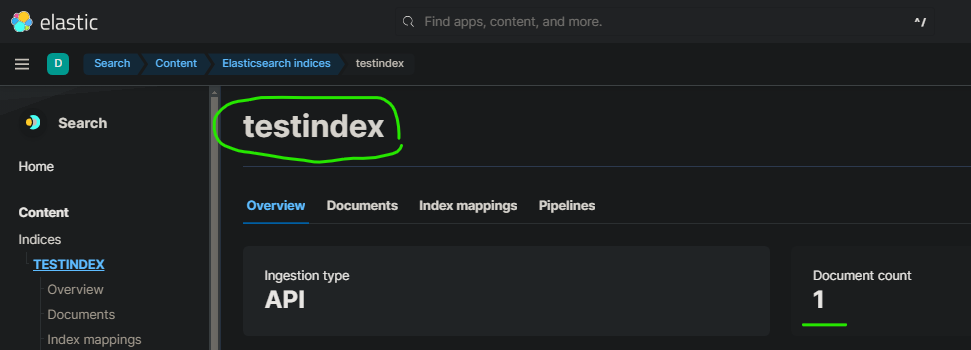
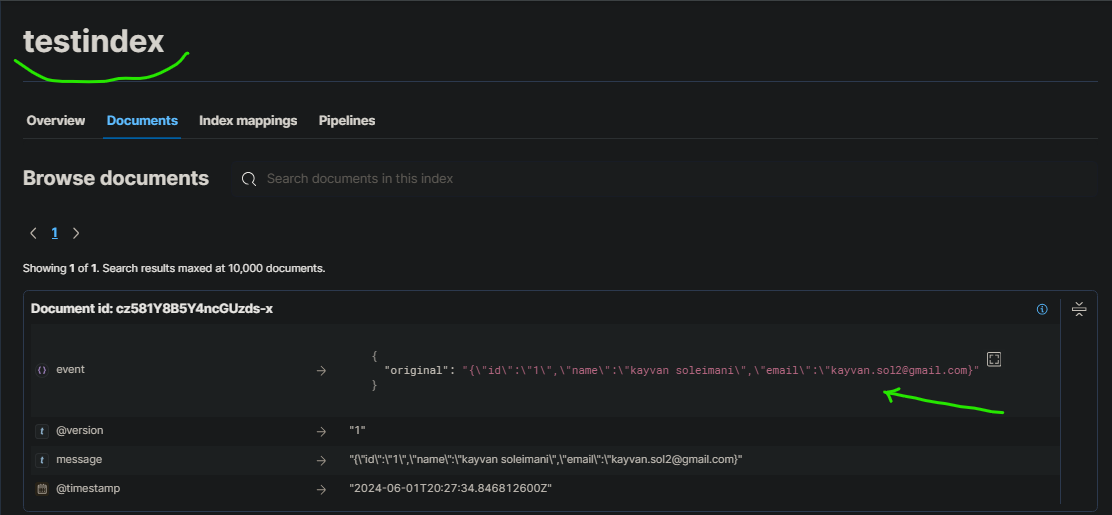
- After some seconds, data appear at your elastic index :
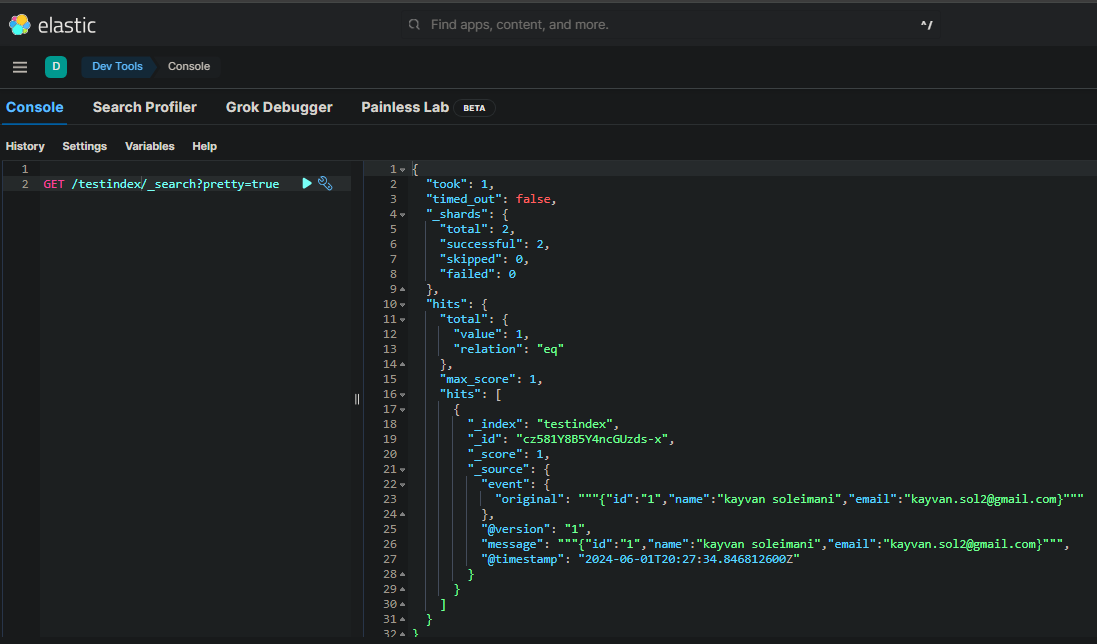
- You can search index records via Dev Tools at kibana :