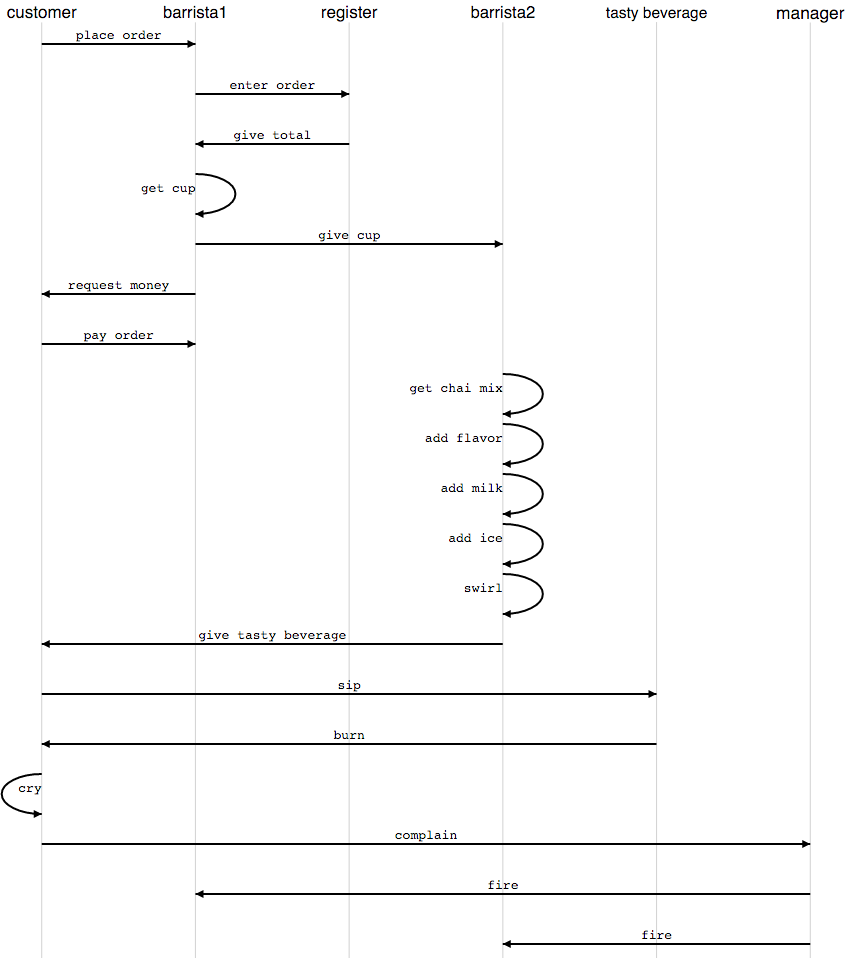
A simple dynamic/static message sequence chart for d3.
Check out the example.
If you just want to generate a static chart, set the fade property to 0.
Set up a message sequence chart:
var msg_seq = d3.messageSequence().fade(5000); // fade time is in msecsthen call the chart on your svg element selection.
d3.select('#container')
  .append("svg")
  .attr("width", "100%")
  .attr("height", "100%")
  .call(msg_seq)
You can then add messages to your chart like so:
var msg = {from: "customer", to: "barrista1", msg: "place order"};
msg_seq.addMessage(msg);
You'll also need to set up some styles, so the chart appears properly, for example:
g.actor line {
  stroke: lightgray;
  stroke-width: 1px;
}

g.message text {
  font-family: monospace;
}

g.message line {
  stroke: black;
  stroke-width: 2px;
}

g.message path {
  stroke: black;
  stroke-width: 2px;
}I didn't include default styles, since I believe you'd need to use !important to override them, which seems janky.
A declarative data method might be a better approach than the imperative addMessage function.
This is a first stab, it's pretty rough. PR's are gladly accepted! 💕.

