CRISPR-DAV is a pipeline to analyze amplicon-based NGS data of CRISPR clones in a high throughput manner. In the pipeline, BWA alignment and ABRA realignment are performed to detect insertion and deletion. The realignment with ABRA has improved detection of large indels. Results are presented in a comprehensive set of charts and an interactive alignment view.
For more details, please check our manuscript https://doi.org/10.1093/bioinformatics/btx518.
The pipeline can be run via a docker container or a physical install. Please see Install-and-Run for instructions.
Results are presented in an HTML report, which looks like this:

The various sections are described below:
Brief information about the amplicon and CRISPR target.
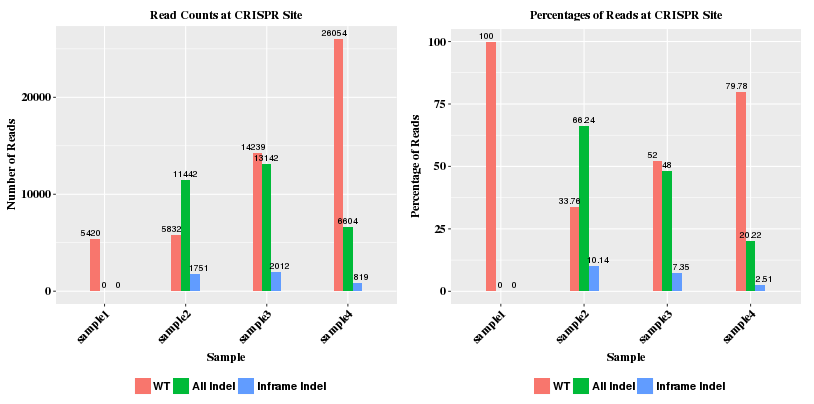
The Count plot shows the number of reads (wild type, indel, and inframe indel) at the CRISPR site. The reads must span the sgRNA sequence region. Wild type reads have no indel in this region. Indel reads have insertion and/or deletion inside and potentially extending beyound the sgRNA region. Inframe indel reads are part of the indel reads, but their indel lengths are multiples of 3 and thus do not cause frame shift in translation.
The Percentage plot shows the percentage of read types with regard to total reads (WT reads + indel reads).
This section shows a group of charts for a particular sample chosen from a dropdown menu.
The first plot shows counting of reads at various stages: raw reads, filtered reads, reads mapped to genome, and reads mapped to amplicon. The second plot shows the numbers of reads on different chromosomes.
If a sample has no reads in the source fastq files or after filtering, the sample will not be drawn in the charts, but a message table would appear below the charts to indicate the issue.

The plots show the read depth in the amplicon range, with grey bar indicating the location of the CRISPR sgRNA region.

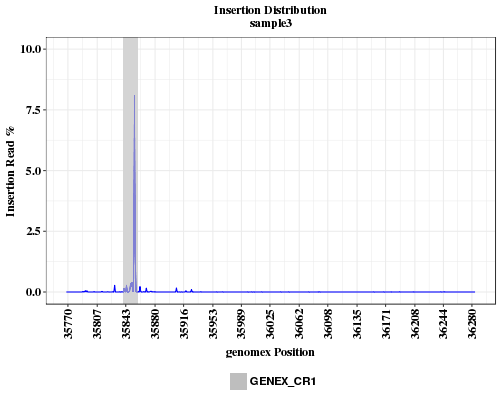
The plots show the insertion rates across the amplicon range. If the insertion is caused by CRISPR, the insertion peak should overlap with the location of CRISRP site.
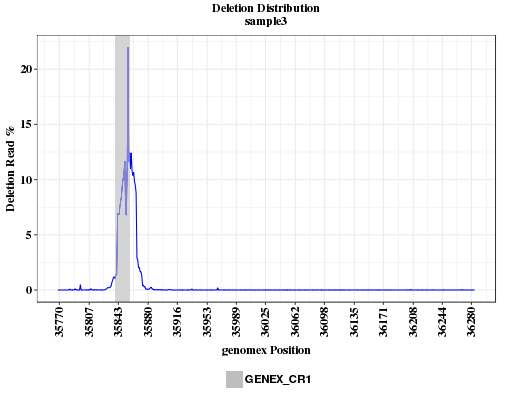
The plots show the deletion rates across the amplicon range. if the deletion is caused by CRISPR, the peak should overlap with the location of CRISRP site.
The plots show the locations and frequencies of the top-abundance alleles, and frequency of WT reads. This helps to understand how CRISPR affects sister chromosomes in a diploid genome.
In control sample where no CRISPR is introduced, there is often no significant number of indel reads. Without several indel alleles, the WT bar will look awefully wide in the plot. In order to maintain similar bar width comparable to other samples, sham alleles of zero reads are added to the plot and labeled like "any:+n" and "any:-n" in x-axis.

The plots show the point mutation rates in and around a CRISPR site. The X axis has the position and reference base on positive strand; the bars indicate the mutant bases. The sgRNA sequence region is marked with a horizontal line. The number of bases on the sides of the sgRNA is determined by the parameter wing_length in the conf.txt file. In the chart below, it can be seen that the Homology-Directed Repair (HDR) clearly introduced expected mutations as indicated in the Gene Table.

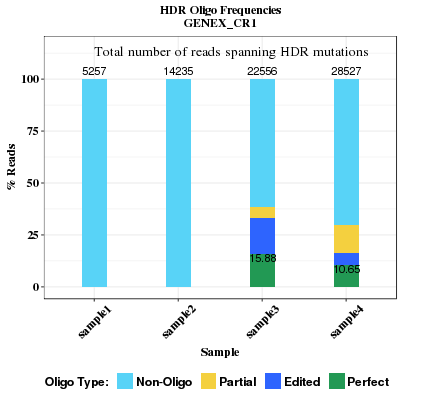
This plot compares the HDR rates across all samples. Oligo nucleotide seqences in HDR region are categorized into 4 types. Their fractions and total reads are indicated. The rate of perfect oligo is labelled. If HDR base changes are not specified in CRISPR bed file (site.bed), the section will not appear.
This is an interactive alignment view of the sequences of sgRNA guide, WT, and indel alleles in the gene. The frequencies of WT, deletion and insert reads are shown. The view is enabled with Canvas Xpress (http://canvasxpress.org/html/index.html). The bars can be zoomed in and out, and moved to the left and right. Only the coding sequence (CDS) is drawn in the bars. If the sgRNA sequence has intronic bases, these bases will not be drawn, causing the sgRNA sequence look shorter than the original. Likewise, if some indel bases are inside intron, they will not be drawn. Deletion is shown as an arc line connecting intact bases. Insertion is shown as a tick mark between two bases. However, the inserted bases are not shown.
This section appears only when (1) the parameter refGene is specified in conf.txt and the gene of interest can be found in the refGene file; or (2) an amplicon sequence is used as reference in lieu of genome, and codon start location is specified, assuming continuous translation.

This shows the parameters used for read filtering, realignment, and SNP plot region.

This section lists the Excel files of results for download.