Everyone likes nice curves. But sometimes, they come in a format that we don't quite like. That is what this tool can fix.
SVG paths are defined as a set of instructions and arguments. There is a good explanation over at MDN, but here's a quick overview.
<path d="M197.6,270C197.6,238.2 176.8,226.6 141.4,226.6L96,226.6L96,366L131.8,366L131.8,316.4L143,316.4C188.6,316.4 197.6,290.6 197.6,270ZM158.6,269.8C158.6,285 153.4,288 142.2,288L131.8,288L131. 8,256L144.2,256C152.8,256 158.6,258.2 158.6,269.8Z" style="fill-rule:nonzero;"/>A path is defined with an XML path element, and some data as the d attribute. If you look at that data, you can read it as instructions (the letters) and arguments (the numbers). With that knowledge, we can have a look at these instructions here.
M197.6,270
C197.6,238.2 176.8,226.6 141.4,226.6
L96,226.6
L96,366
L131.8,366
L131.8,316.4
L143,316.4
C188.6,316.4 197.6,290.6 197.6,270
Z
M158.6,269.8
C158.6,285 153.4,288 142.2,288
L131.8,288
L131. 8,256
L144.2,256
C152.8,256 158.6,258.2 158.6,269.8
Z
These instructions are as follows
| Command | Meaning |
|---|---|
| M x y | Move to the coodinate (x, y) |
| L x y | Draw a line from current coordinate to (x, y) |
| H x | Draw horizontal line to (x, y) where y is current |
| V y | Draw vertical line to (x, y) where x is current |
| Z | Move back to initial coordinate |
| C x1 y1 x2 y2 x y | Draw bézier curve to (x, y) using (x1, y1) and (x2, y2) as control points |
| S x2 y2 x y | Draw bézier curve to (x, y) using the reflection of the previous second control point and (x2, y2) as control points |
| Q x1 y1 x y | Draw quadratic curve to (x, y) using (x1, y2) as control point |
There's a few more that I have omitted. As you can see, this means that SVG supports both quadratic and cubic curves. So what are they, and what are the differences?
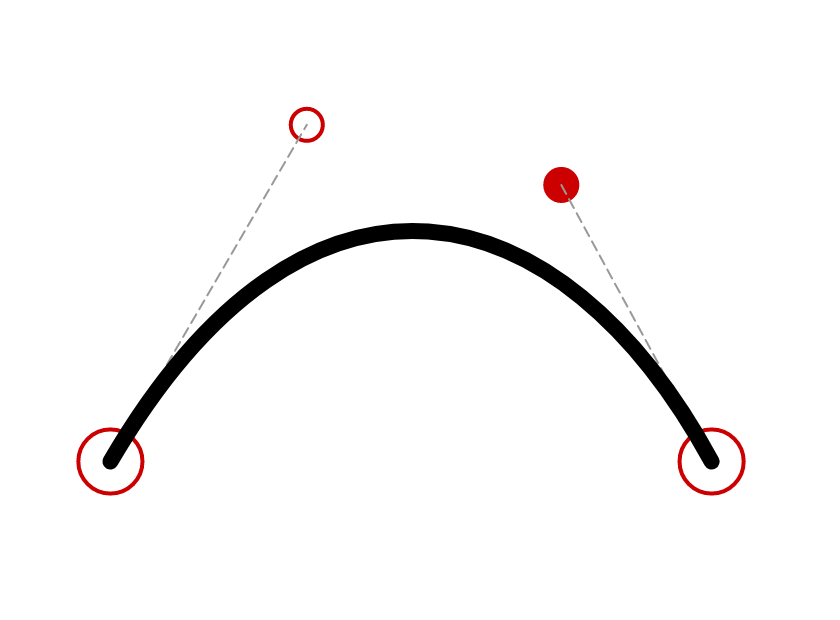
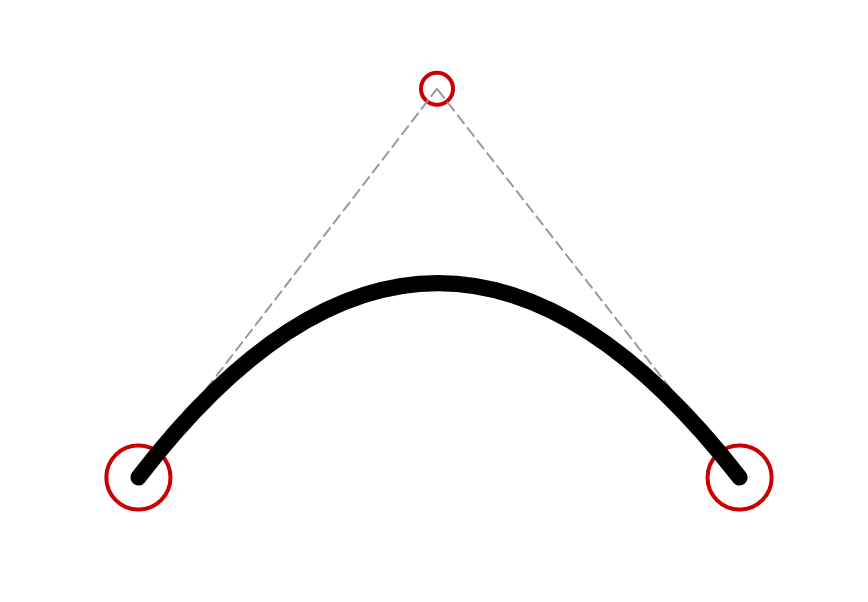
There are two really good demos for quadratic and cubic that illustrate how they work, and the differences between them.
This tool can convert between the curve types.

